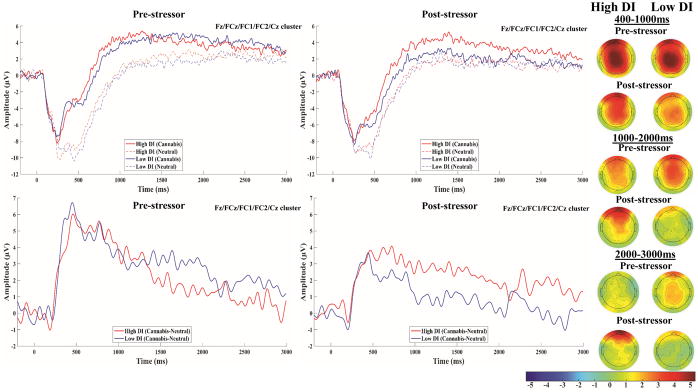
Figure 1.
Stimulus-locked ERPs to cannabis and matched neutral images at pre (top-left) and post-stressor (top-right) in the high and low DI groups are presented at the averaged frontal-central cluster (Fz, FCz, FC1, FC2, Cz). Stimulus-locked difference waves (i.e., cannabis – matched neutral) at pre (bottom-left) and post-stressor (bottom-right) in the high and low DI groups are presented at the averaged frontal-central cluster; a 15 Hz low-pass filter was applied to the difference waves for display purposes only. Topographical maps of the 400–1000ms, 1000–2000ms, and 2000–3000ms difference wave amplitudes at pre and post-stressor in high and low DI groups are presented on the right; the colorbar scale is in microvolts.

