
Figure 1. Differential expression between schizophrenia cases and controls in the DLPFC.
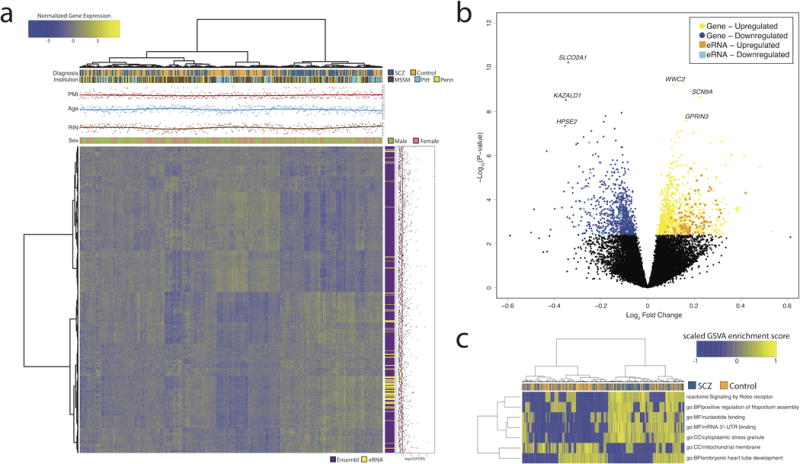
(a) Bivariate clustering of individuals (columns) and genes (rows) depicting the case-vs.-control differences of the 1,647 genes and 118 eRNAs that were differentially expressed. Bars and scatterplots on top show disease status, brain bank (MSSM, Mount Sinai brain bank; Pitt, University of Pittsburgh brain bank; Penn, University of Pennsylvania brain bank), postmortem interval (PMI), age at death (Age), RNA integrity number (RIN), and gender. The vertical color bar and scatter plot illustrate the transcript type and -log10(FDR) values from the differential expression analysis, respectively. (b) Volcano plot illustrating the distribution of log2 fold-changes and -log10 P-values of transcripts in the differential expression analysis. Coloring indicates differentially expressed genes and eRNAs. (c) Bivariate clustering of individuals (columns) and gene sets (rows) based on their GSVA enrichment score for the 7 significant gene sets (Bonferroni-adjusted P ≤ 0.05). The GSVA score indicates whether genes in a pathway are concordantly activated in one direction, either over-expressed (yellow) or under-expressed (blue) relative to the overall population. The color bar indicates disease status.