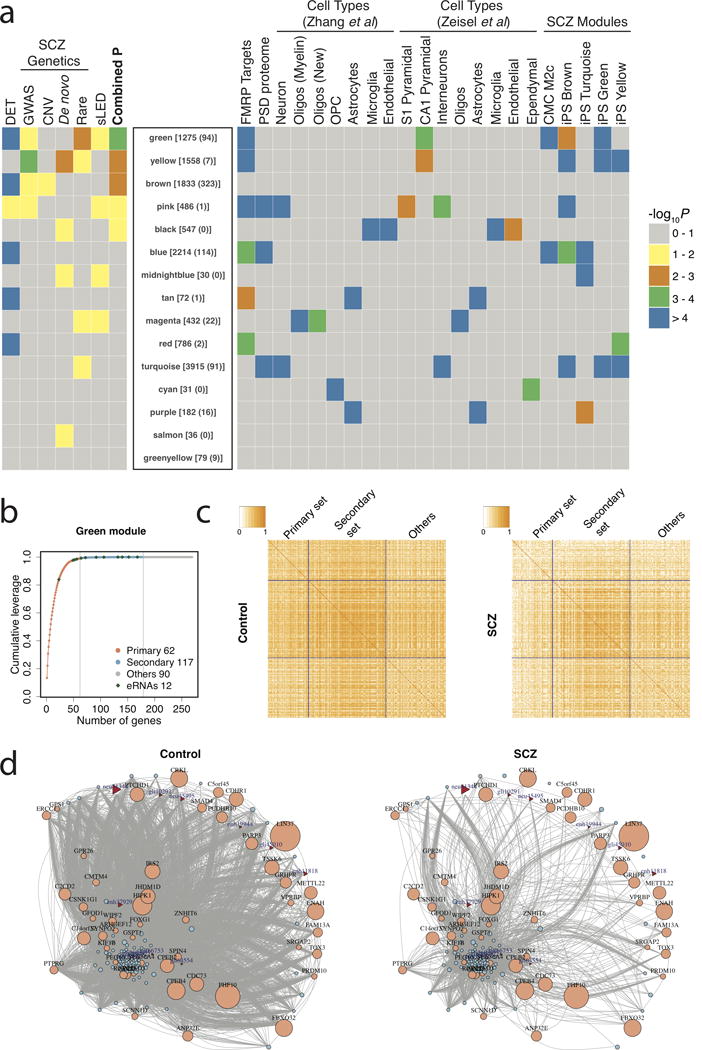
Figure 2. Co-expression network analysis.

(a) Rank of modules based on a combined P-value including differentially expressed transcripts (DET), prior SCZ genetic associations (GWAS, copy number variants [CNVs], de novo mutations, rare nonsynonymous mutations), and differences in the co-regulation of transcripts among patients with SCZ and controls, using a sparse-Leading-Eigenvalue-Driven (sLED) test. The number of total transcripts and eRNAs in each module is given in brackets and parentheses, respectively. The enrichment of each module with fragile X mental retardation protein (FMRP) targets, postsynaptic density proteins, cell type-specific markers, and SCZ associated modules from prior studies, is depicted at right. (b) Scree plot of sLED leverage in the green module, in which 179 transcripts are detected to have non-zero leverage, including the primary set with 62 transcripts that account for 99% of the leverage, and the secondary set with the remaining 117 transcripts that account for 1% of the leverage. “Others” consist of 90 additional randomly selected transcripts. (c) Absolute correlation matrices among transcript categories in control and SCZ samples. (d) Gene co-expression networks of top genes in the green module in control and SCZ samples. Edges represent absolute correlation |rij| ≥ 0.5 between gene pairs. Ensembl and eRNA transcripts are indicated with circles and triangles, respectively. The size of the nodes indicates the sLED leverage of each transcript. Ensembl transcripts without annotated gene symbols and unconnected transcripts were excluded.
