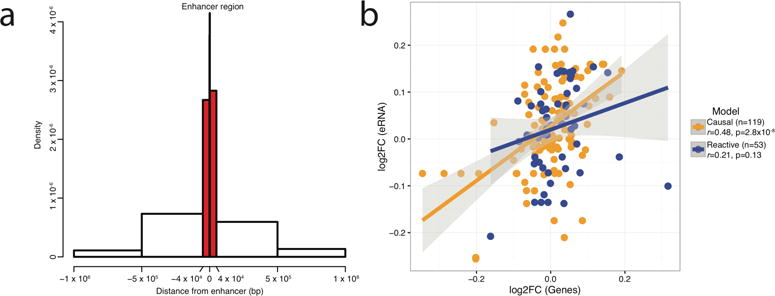
Figure 3. Association of eRNA-level QTL (enhancer expression QTL or eeQTL) with gene-level QTL (gene expression QTL or geQTL).

(a) Distribution of cis-eeQTL location relative to the center of the enhancer. The majority of eeQTL SNPs (eeSNPs) were located within the enhancer region (1.5 kb upstream or downstream from the center of the eRNA) or within 40 kb upstream or downstream from the center of the eRNA (highlighted in red). For each eRNA, only the most significant cis-eeQTL was used for this analysis. (b) Correlation scatterplot for log2 fold-changes (log2FC) among cases with SCZ and controls for eRNA-gene pairs that have support for causal (n = 119), or reactive (n = 53) interactions. The correlation was significant only for eRNA-genes that support the causal model.
