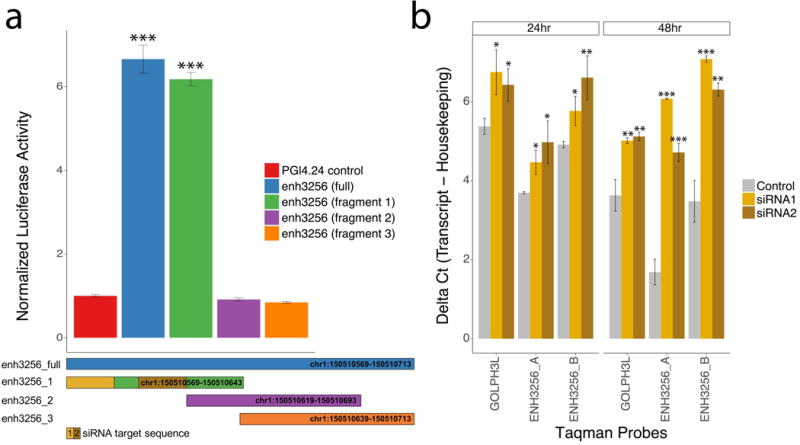
Figure 5. Examining the enhancer activity and regulatory role of enh3256 in GOLPH3L expression.

(a) Examining luciferase expression driven by full length (145 bp) and smaller, overlapping, 75 bp fragments of the enh3256 sequence in HEK293 cells. The full-length construct and fragment 1 resulted in increased luciferase activity compared to empty pGL4.24 vector and fragments 2 and 3. (b) qPCR analysis of enh3256 eRNA and GOLPH3L mRNA for HEK293 cells transfected with control and two different siRNAs targeting enh3256 (siRNA1 and siRNA2). qPCR quantification was performed using Taqman probes measuring enh3256 (ENH3256_A and ENH3256_B) and GOLPH3L, 24 and 48 hours after transfection. Higher delta Ct values indicate lower relative expression for each Taqman probe. Taqman probe expression was normalized to b-2-microglobulin in all cases. Expression of luciferase activity was normalized to Renilla Luciferase. Data represent mean ± standard deviation. Statistical significance was determined by two-tailed Student’s t-test. *P < 0.01; **P < 0.05; and ***P < 0.005 versus control.
