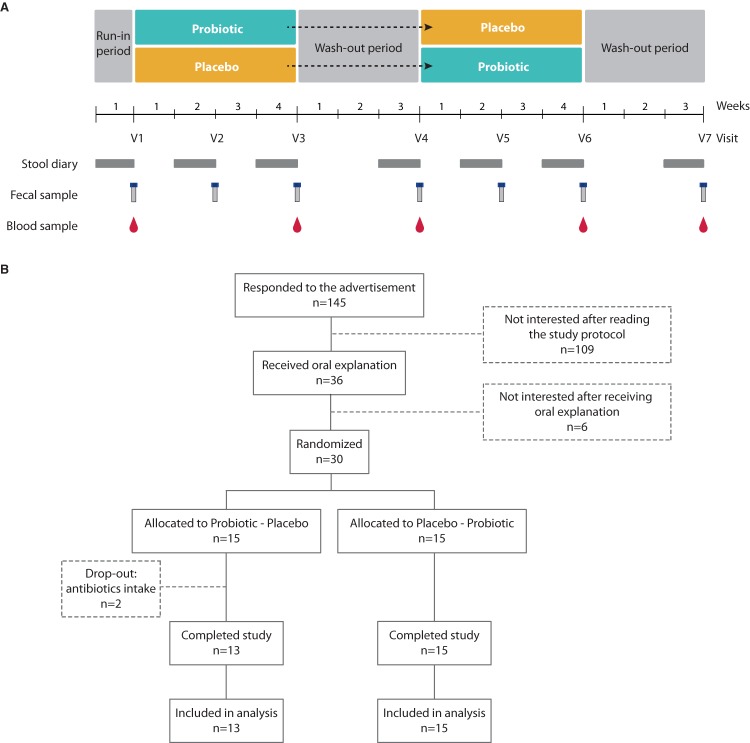
FIG 1.
Study design. (A) Schematic representation of the study design. Stool diaries and samples were collected as depicted. V1 to V7 represent study visits before, during, and after each intervention and/or washout period. (B) Participant flow diagram showing the number of participants at each stage and reason for dropping out.

