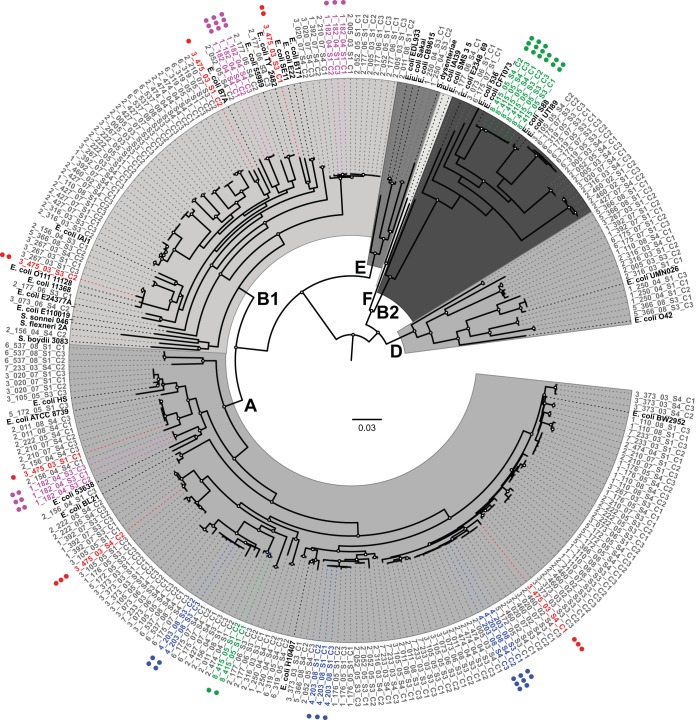
FIG 3.
Phylogenomic analysis of E. coli isolates in study. A whole-genome phylogeny of the isolate sequences and reference E. coli and Shigella genomes (shown in black) highlighting examples of diversity among subject-specific isolates within and across time points. The scale bar indicates the approximate distance of 0.03 nucleotide substitutions per site. Nodes with bootstrap values of greater than 90 are marked with a circle. Examples of isolates from subjects that demonstrate the greatest (3_475_03) and least (4_203_08, 8_415_05, and 1_182_04) amount of diversity are highlighted: 3_475_03 in red, 4_203_08 in blue, 8_415_05 in green, and 1_182_04 in purple. The number of dots denotes the sample number from which the isolate was obtained. E. coli phylogroups are labeled. A full figure with all subjects is presented in Fig. S1.

