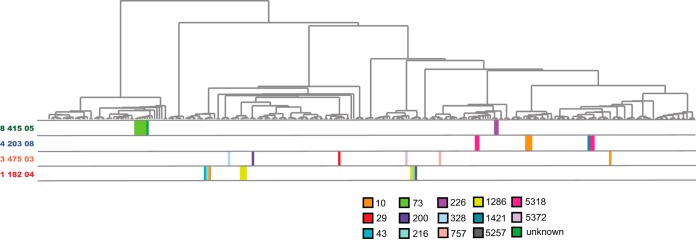
FIG 4.
Phylogenomic distribution of sequence types of isolates from select subjects. A cladogram of the phylogeny highlighting relative positions of genomes of isolates from selected subjects with MLST sequence types shown in colored blocks corresponding to the sequence type as shown in the legend. Selected example subjects highlight low diversity within time points but high diversity across time (subject 1_182_04), high diversity within and across time (3_475_03), intermediate diversity across time (4_203_08), and low diversity across time (8_415_05).

