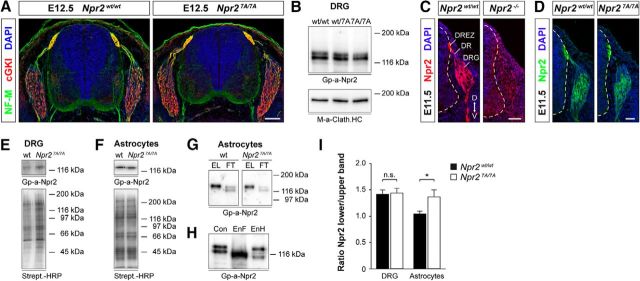
Figure 2.
Npr2-7A protein is expressed on the cell surface of DRGs. A, Cross sections of the spinal cord from Npr27A/7A and Npr2wt/7A E12.5 embryos stained with anti-neurofilament, anti-cGKI, and DAPI reveal a normal overall structure of the spinal cord in Npr27A/7A mutants. Scale bar, 100 μm. B, Western blots of detergent extracts of DRGs from E13.5 Npr27A/7A, Npr2wt/7A, and Npr2wt/wt embryos, indicating similar amounts of Npr2 protein in all three genotypes. Npr2 and Npr2-7A are composed of two major bands. The bottom served as loading control using a monoclonal antibody to the heavy chain of clathrin. Right, Molecular mass markers. C, D, Transversal sections of the spinal cord from Npr27A/7A, Npr2LacZ/LacZ (representing Npr2−/−), and Npr2wt/wt stained with anti-Npr2, demonstrating expression of Npr2-7A-mutated protein in the somata of DRG neurons, in the dorsal root and dorsal root entry zone and the developing dorsal funiculus axons. Hyphenated line indicates the border of the spinal cord. Scale bar, 50 μm. D, Dorsal; DR, dorsal root; DREZ, dorsal root entry zone; V, ventral. E, F, Expression of Npr2 variants on the surface of DRGs and of cortical astrocyte cultures from wild-type or Npr27A/7A mutants. Cell surface proteins on freshly picked DRGs or cultivated astrocytes were labeled by sulfo-NHS-biotin followed by isolation with streptavidin agarose. Bottom, Equal protein loading was controlled by streptavidin-HRP. Right, Molecular mass markers. G, Western blot of Npr2 and Np2–7A from cortical astrocyte cultures that were cell surface biotinylated by sulfo-NHS-biotin followed by purification using streptavidin beads. The biotinylated fraction is composed of one major band in both genotypes, whereas the unbound fraction contains two bands (for DRGs, see also Fig. 2B). EL, Eluate of streptavidin beads (bound, biotinylated fraction of Npr2); FT, flow through of streptavidin beads (unbound fraction of Npr2). H, Western blot of Npr2 from astrocyte cultures treated with endoglycosidase F (EnF) or endoglycosidase H (EnH). EnF treatment resulted in one major band, whereas EnH treatment resulted in a significant shift of the lower Npr2 band. A weak stained band between both major bands might represent not fully endoglycosidase H-dependent deglycosylated Npr2. I, Quantification of Western blots of the ratio of the two major components from DRGs or astrocyte cultures from Npr27A/7A or Npr2wt/wt. Upper band is considered as mature Npr2 expressed at the cell surface. Lower band is considered as immature Npr2 expressed intracellularly. Number of blots analyzed: 9 for DRGs of each genotype, 12 for wild-type, and 9 for mutant astrocytes. Error bar indicates SEM. *p = 0.0197, for astrocytes (t test).

