Figure 3.
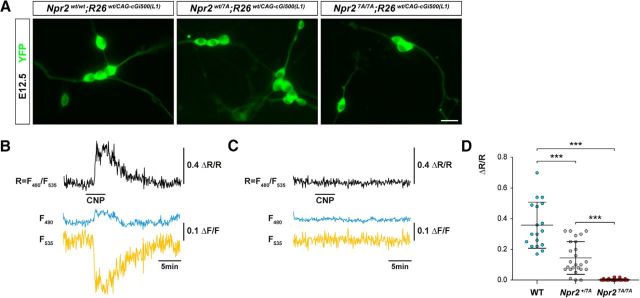
FRET-based cGMP imaging of individual DRG neurons from E12.5 Npr2wt/wt, Npr2wt/7A, and Npr27A/7A embryos expressing the genetically encoded cGi500 cGMP biosensor. A, Representative images of cGi500 biosensor fluorescence in dissociated E12.5 DRG neurons from Npr27A/7A, Npr2wt/7A, and Npr2wt/wt 24 h after plating. Scale bar, 10 μm. B, C, Changes in fluorescence of the genetically encoded cGi500 cGMP biosensor elicited by application of 200 nm CNP (horizontal bar) recorded from individual DRG neurons from wild-type (B) and Npr27A/7A (C) mice. Traces indicate CFP emission (F480, blue), YFP emission (F535, yellow), and the CFP/YFP emission ratio (r = F480/F535, black). Emission intensities and ratios were normalized to average baseline signals and given as ΔF/F and ΔR/R, respectively. Alterations of ΔR/R indicate changes of the intracellular cGMP concentration. Shown are representative results from five experiments with independent cell cultures. D, Scatter blot of the peak amplitudes of normalized CFP/YFP emission ratios recorded from DRG neurons perfused with 200 nm CNP from wild-type, Npr2wt/7A, and Npr27A/7A mice. Data are mean ± SD (wild-type, n = 18; Npr2wt/7A, n = 25; Npr27A/7A, n = 32). ***p < 0.0001 (Mann–Whitney test).

