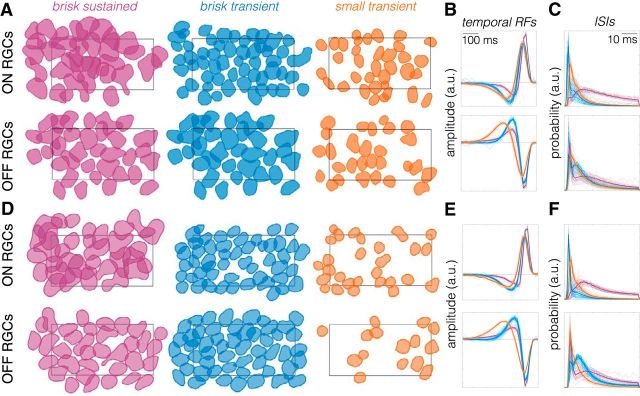
Figure 3.
Classified ON and OFF RGCs exhibit a mosaic-like organization. A, Spatial RFs of ON and OFF brisk sustained (purple), brisk transient (blue), and small transient (orange) RGCs identified in one retina. Spatial RFs are shown as a contour plotted at 0.6065 of the peak amplitude (equivalent to 1 SD of Gaussian). The rectangle shows the outline of the MEA (900 × 1800 μm). B, Temporal RFs of all cells shown in A, with ON cells on top and OFF cells on bottom. Thin lines are individual cells, thick lines are the mean. Color conventions are the same as in A. C, ISI distributions for all cells in A. Color and line conventions same as in A and B. D–F, Same as A–C, but for a second retina.

