Figure 3.

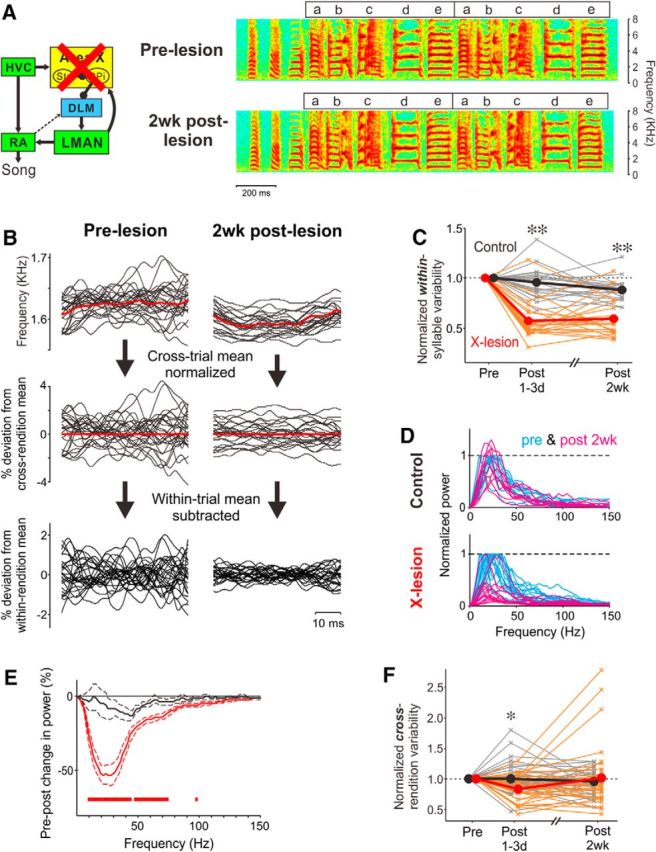
Area X is required for within-syllable vocal variability. A, Circuit diagram indicating lesions of Area X (left) and spectrograms of songs of an adult zebra finch recorded before and after 2 week (2wk) bilateral lesions of Area X (right). Conventions are as in Figure 1, A and B. B, Examples of FF trajectories of syllable e in pre-lesion (left) and 2 week post-lesion (right) songs, expressed as raw frequency traces (top), percent deviation from cross-rendition mean (middle), and percent deviation from within-rendition mean (bottom). Twenty consecutive trajectories are shown. Red traces indicate across-rendition means. C, The magnitude of within-syllable FF variability (within-rendition SD of mean-subtracted FF trajectory, averaged across renditions) normalized by that of pre-lesion song in Area X-lesion (red) and control (black) birds. Thin lines correspond to one syllable, and thick lines indicate the mean across all syllables. **p < 10−4. D, Power spectra of FF trajectories pre-lesion (blue) and 2 weeks post-lesion (magenta) in control (top) and Area X-lesion (bottom) birds, normalized by the peak height of the spectrum in pre-lesion song; each line corresponds to one syllable. E, Changes in mean (±SEM) power spectrum of FF trajectories from pre-lesion to 2 weeks post-lesion, normalized to the peak height of the presong spectrum, in Area X-lesion (red) and control (black) birds. The red bars indicate the frequency ranges where Area X-lesion data were significantly different from control data (see Materials and Methods). F, For the same syllables, Area X lesions did not permanently eliminate cross-rendition variability in FF. Conventions are as in C. *p < 0.01.
