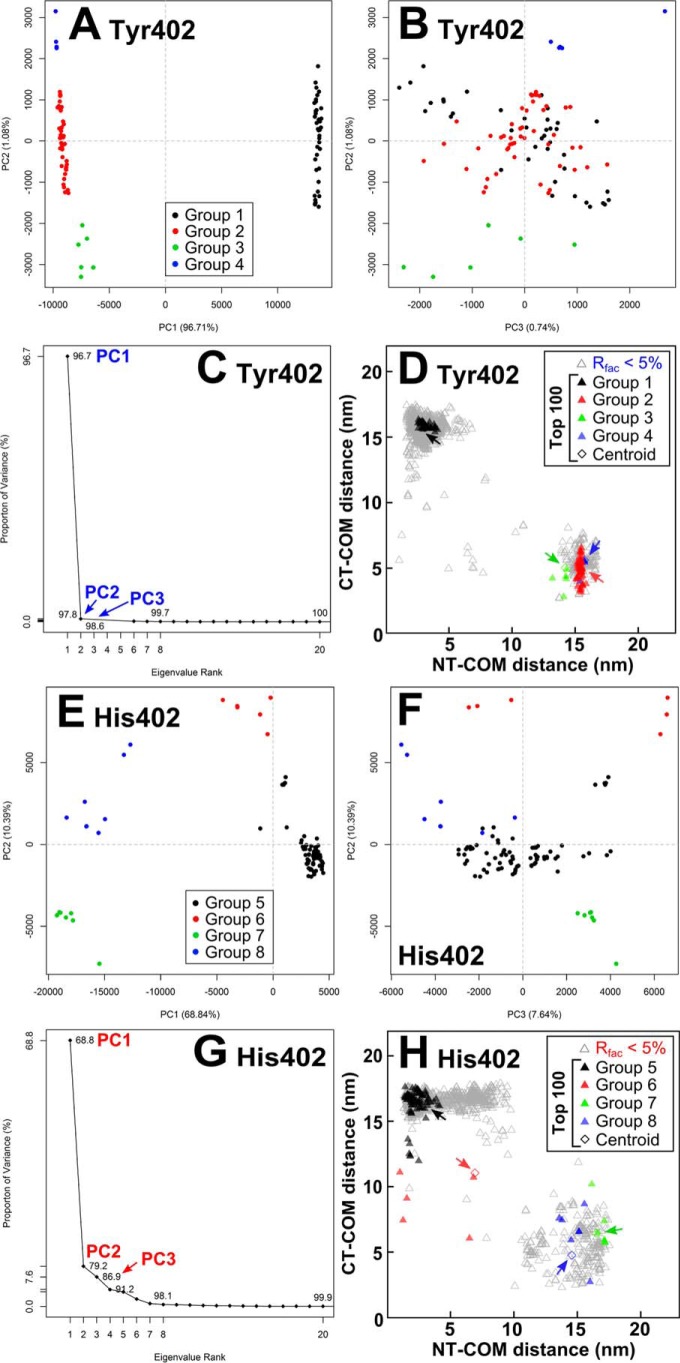
Figure 11.
Principal component analyses of the 100 best-fit models for FH Tyr-402 and FH His-402. For FH Tyr-402 (A and B) and FH His-402 (E and F), the 100 best-fit models were grouped by PCA into four groups, 1–4 (black, red, green, and blue, respectively), as exemplified by the first three principal components (PC2 versus PC1 and PC3 versus PC2). C and G, first three eigenvalue rankings (PC1 to PC3) accounted for variances of 98.5 and 86.9% in the 100 best-fit FH models. D and H, black, red, green, and blue triangles correspond to the PCA groups 1–4 and 5–8 in each set of best-fit 100 models. The four arrowed diamonds correspond to the average (centroid) model for each PCA group.

