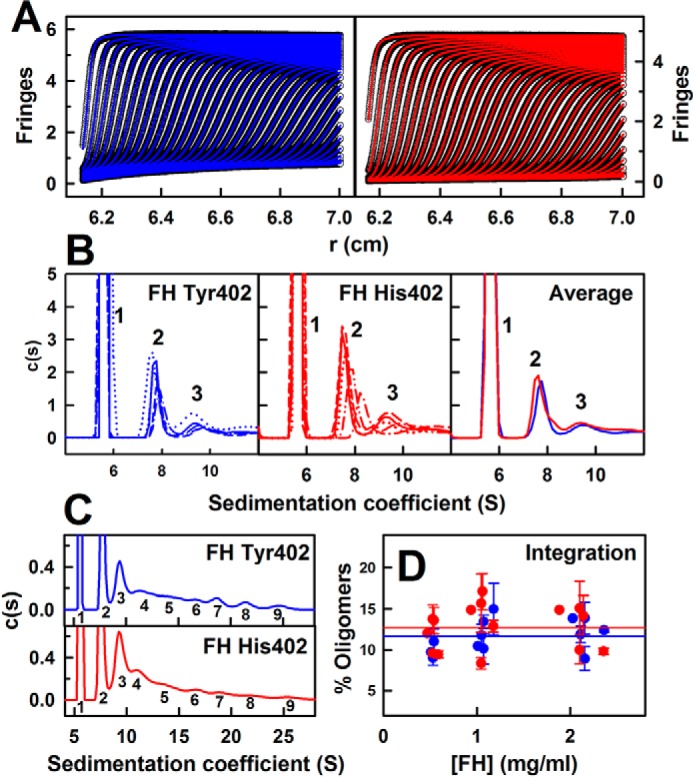
Figure 3.

Sedimentation velocity c(s) size-distribution analyses for FH Tyr-402 and FH His-402. All analyses correspond to 1.1 mg/ml FH. A, representative sedimentation boundary fits corresponding to FH Tyr-402 (blue) and FH His-402 (red) are shown using only every 10th scan for clarity. The experimental data are shown in black. B, peaks 1–3 in the c(s) analyses for five FH Tyr-402 and five FH His-402 samples (red) are shown in different line styles. The averaged c(s) plots for FH Tyr-402 and FH His-402 are shown at the right. The monomer peak 1 at 5.7 S is normalized to 100. C, full c(s) analyses for FH Tyr-402 and FH His-402 reveal up to nine FH oligomer species starting with peaks 1 and 2 for monomer and dimer and extending to peak 9 for presumed nonamers. D, proportion of FH oligomers was derived by integration of the c(s) analyses for peaks 2–9 for the five FH Tyr-402 and FH His-402 samples at concentrations between 0.5 and 2.4 mg/ml. Statistical error bars are shown where visible. The mean proportion of oligomers is shown as horizontal lines.
