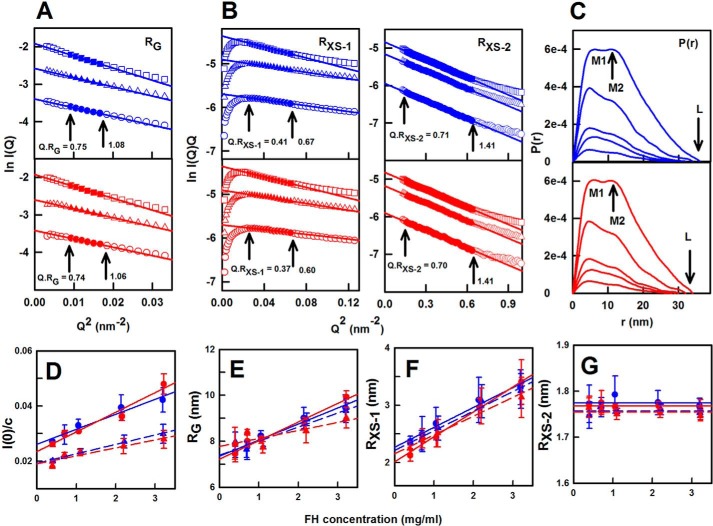
Figure 7.
X-ray scattering analyses of FH Tyr-402 and FH His-402. In the Rg and RXS Guinier analyses, the filled symbols correspond to the I(Q) data used to determine the Rg or RXS values, and the straight lines correspond to the best fit through those points. The Q·Rg fit ranges are arrowed. A, Rg plots of ln I(Q) versus Q2 at low Q values for FH Tyr-402 (blue) and FH His-402/Val-62 (red) at concentrations of 1.1 mg/ml (○), 2.2 mg/ml (▵), and 3.2 mg/ml (□). The Q fit range was 0.09–0.13 nm−1. B, corresponding cross-sectional RXS-1 and RXS-2 fits of ln I(Q). Q versus Q2 values are shown using Q fit ranges of 0.16–0.26 and 0.4–0.8 nm−1, respectively. C, distance distribution function P(r) analyses are shown at concentrations of 0.4, 0.7, 1.1, 2.2, and 3.3 mg/ml. D–G, concentration dependences of the I(0)/c, Rg, RXS-1, and RXS-2 parameters are shown for FH Tyr-402 and FH Tyr-402/Val-62 (blue; ● and ▴) and FH His-402/Val-62 (red; ● and ▴). Each value was measured in quadruplicate and then averaged and fitted by linear regression except in G when the mean was shown. Statistical error bars are shown where visible. D, I(0)/c intensities were measured in two beam sessions, resulting in two different pairs of lines. E, the Rg values at zero concentration were 7.39 ± 0.25 and 7.35 ± 0.13 nm (FH Tyr-402) and 7.22 ± 0.15 and 7.77 ± 0.27 nm (FH His-402) (Table 3). F, RXS-1 values at zero concentration were 2.21 ± 0.06 and 2.27 ± 0.06 nm (FH Tyr-402), and 2.02 ± 0.06 and 2.15 ± 0.06 nm (FH His-402). G, averaged RXS-2 values were 1.77 and 1.77 nm (FH Tyr-402) and 1.76 and 1.75 nm (FH His-402).

