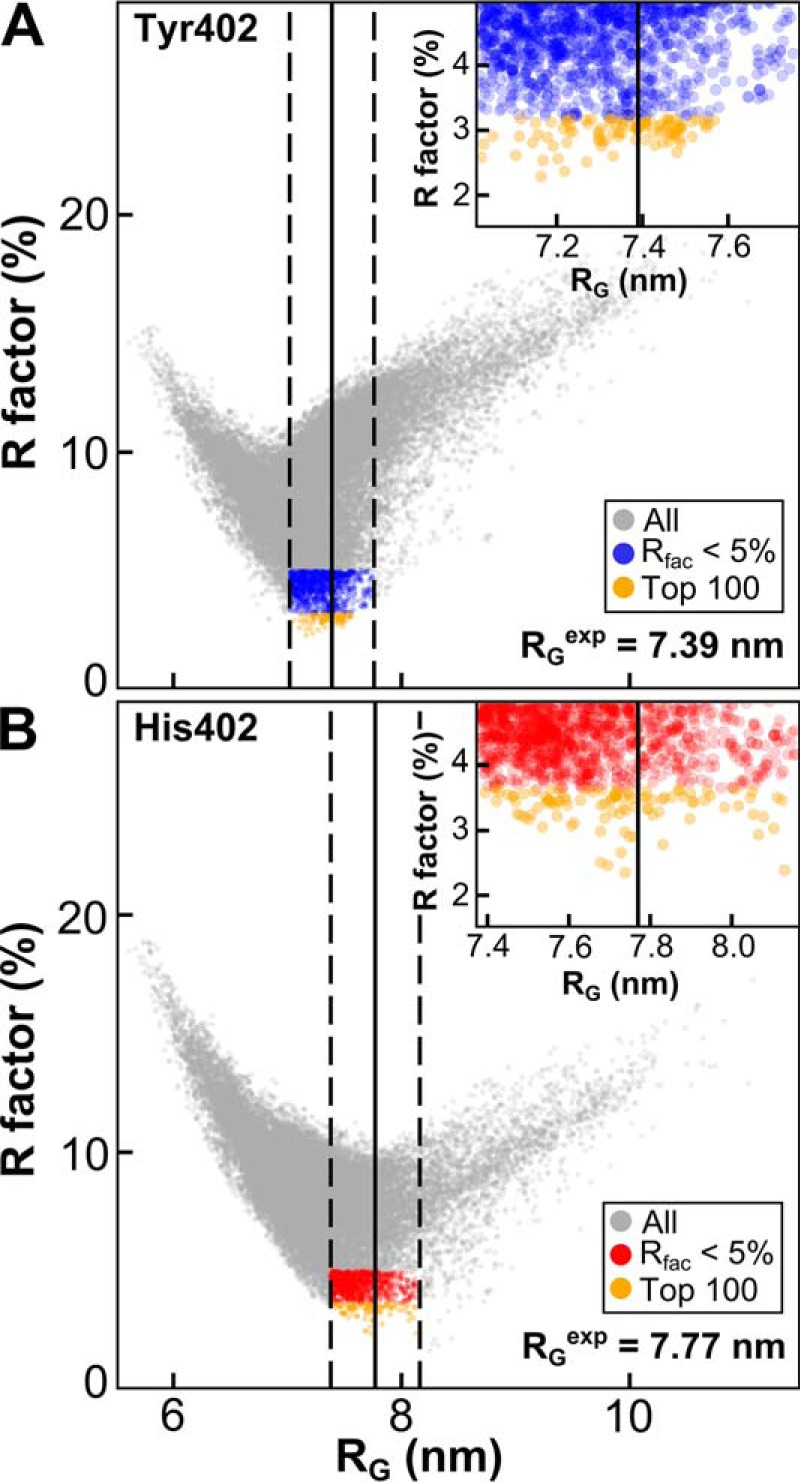
Figure 8.

Atomistic modeling searches for the FH solution structure. The 29,715 FH models were fitted to one experimental scattering curve for each of homozygous FH Tyr-402/Val-62 (A) and FH His-402/Val-62 (B), each extrapolated to zero concentration. Gray corresponds to all FH models. The blue/red subsets corresponds to FH models that passed two filters, namely Rg within ±5% of the experimental Rg and an R-factor of <5%. Orange corresponds to the 100 best-fit FH models (see inset). The vertical black lines represent the experimental Rg for FH Tyr-402 (7.39 nm) and FH His-402 (7.77 nm). The dashed lines represent the ±5% upper and lower boundaries of these Rg values.
