Figure 3.
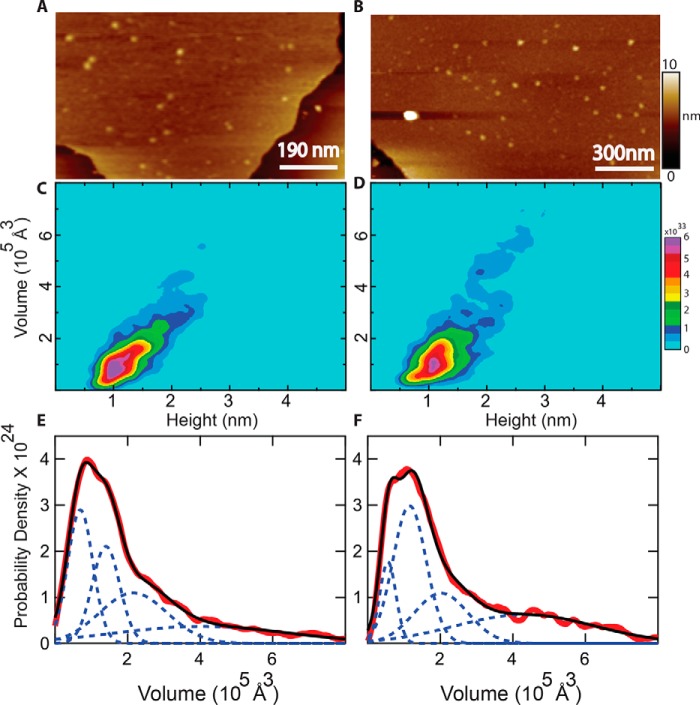
AFM of OprG in lipid bilayers. A, representative image of WT OprG in lipid bilayer. B, representative image of P92A OprG in lipid bilayer. Lipid bilayers were identified by measuring step heights at the edges, which can be seen in both images. Protrusions of the individual OprG particles above the membrane were visualized by AFM (light brown color). The full color scale is shown on the right. C and D, height-volume distributions of membrane protrusions of WT (C) and P92A (D) OprG in lipid bilayers. E and F, modeling of the experimental volume distributions (red) of WT (E) and P92A (F) OprG as superpositions of Gaussians (dashed blue lines). The sums of these Gaussians are shown in black.

