Figure 4.
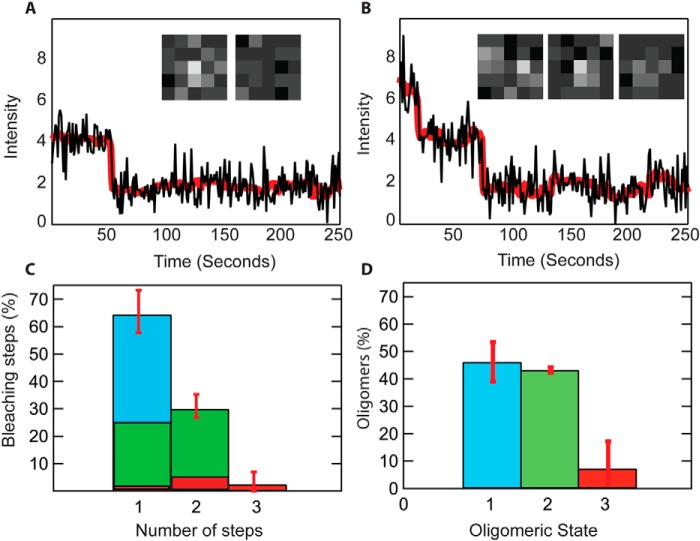
Single molecule photobleaching of OprG in lipid bilayers. A and B, bleaching steps of single fluorescent protein complexes in lipid bilayers reveal the numbers of Alexa 647-labeled subunits. Examples of single-step (A) and two-step (B) bleaching traces are shown. The black lines represent mean intensity values from 5 × 5 pixel2 regions. The red lines represent the Chung-Kennedy nonlinear filtered versions of the data. C, average fractions of observed bleaching steps from 10 movies of two different protein reconstitutions. Division of bars into blue, green, and red illustrate the calculated fractions of monomers, dimers, and trimers within one observed population, as explained under “Experimental procedures.” D, total oligomeric fractions of monomers (blue), dimers (green), and trimers (red) are calculated from data in C.

