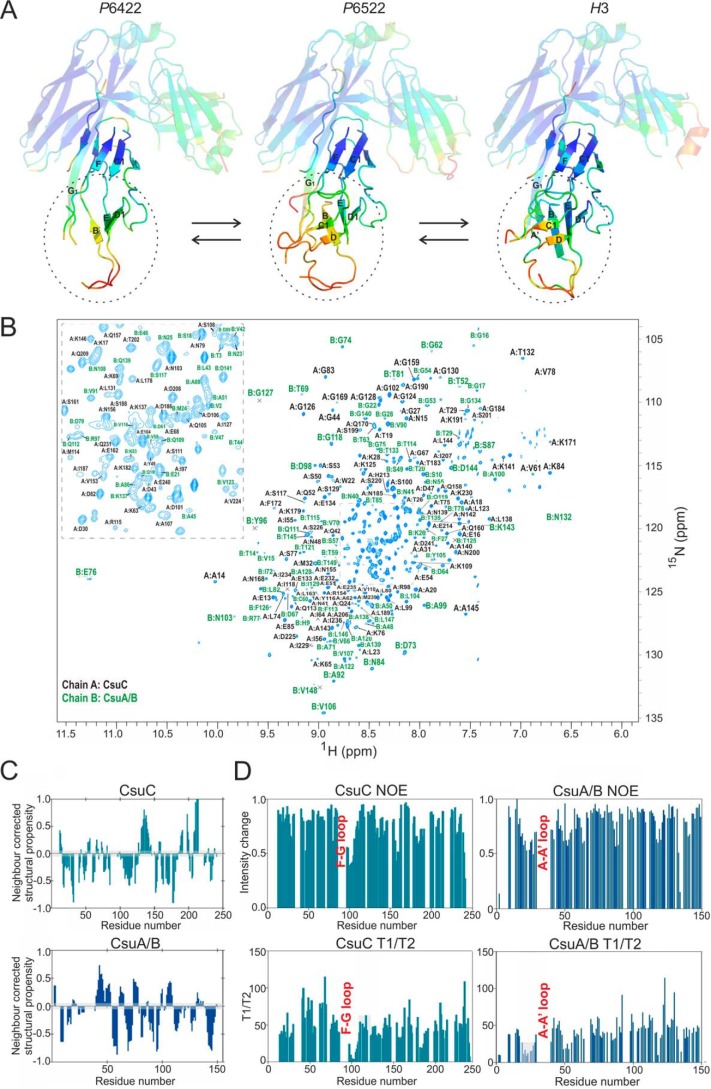
Figure 1.
CsuC traps CsuA/B in a substantially disordered conformation. A, diagrams of crystal structures of CsuC-CsuA/B (43 kDa) in space groups P6422, P6522, and H3 colored by B-factor of Cα atoms with the color ranging from blue (lowest) to red (highest). CsuC is semi-transparent. β-Strands in CsuA/B and strand G1 in CsuC are labeled. B, 1H,15N-TROSY spectrum of CsuC-CsuA/B highlighting the 76% backbone resonance assignment. C, ncSCP chemical shift analysis of CsuC (a) and CsuA/B (b) in complex. Deviations from the expected disorder chemical shift range, within the gray boundary, predict helical (positive) or β (negative) structural propensity. D, relaxation analysis of CsuC and CsuA/B. Heteronuclear steady-state 1H,15N-NOE values (top) and T1/T2 values (bottom) are shown. Residues encompassing the loop upstream of the G1 strand in CsuC and loop between A and A′ strands in CsuA/B are indicated.

