Figure 2.
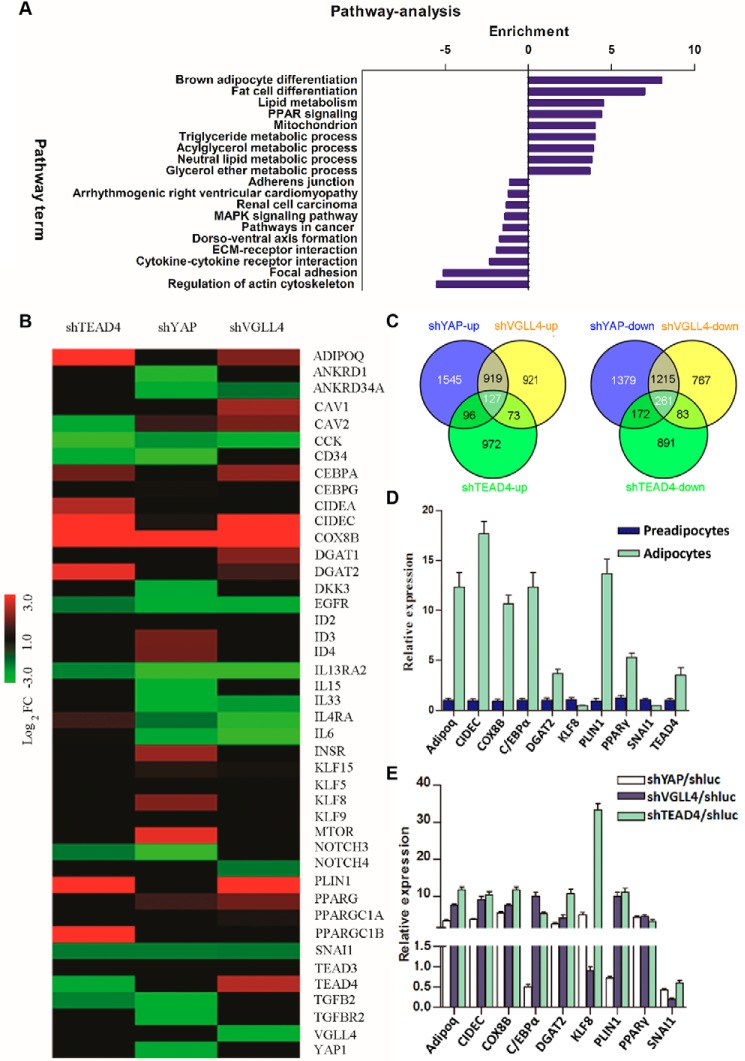
TEAD4, YAP, and VGLL4 modulate adipogenesis-related pathways. A, KEGG pathway analysis. Common genes that were regulated more than 2-fold by knockdown of TEAD4/YAP/VGLL4 3T3-L1 cells after adipogenic mixture induction for 7 days were submitted to DAVID KEGG pathway analysis. The x axis indicates pathway enrichment by value of −log10 (p value). Both up-regulated and down-regulated signaling pathways are shown. B, microarray heatmaps of the above samples showing the differential expression profiles of adipogenesis-related genes. Red indicates up-regulated genes, and green indicates down-regulated genes. Colors are set by the value of log2 (-fold change). C, Venn analysis of the microarray-identified genes that were altered more than 2-fold. The numbers of common altered genes are shown. D and E, qRT-PCR validation of the altered genes identified by microarray. Shown are gene expression profiles between preadipocytes and adipocytes and normalized to β-actin expression (D) and gene alternation in shYAP, shVGLL4, or shTEAD4 3T3-L1 cells after adipogenic mixture induction for 7 days. E, these genes' -fold change was normalized to shluc 3T3-L1 control samples. Each value represents the average of three independent repeats.

