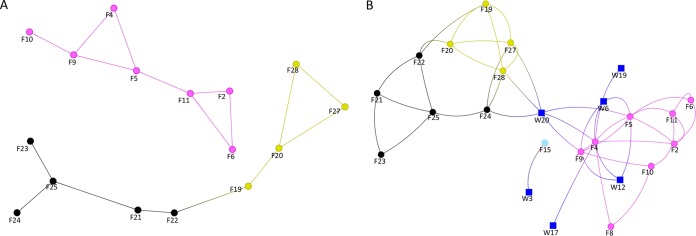
FIG 2.
Network analysis of E. faecium isolates from farms and wastewater treatment plants. Lines are drawn between farms/plants sharing isolates less than seven SNPs (A) or 35 SNPs (B) apart, indicating approximately 1 and 5 years of evolution, respectively. Lines only show binary links between farms, with arbitrary line lengths. Blue square, wastewater treatment plant; pink circle, pig farm; light blue circle, cattle farm; black circle, turkey farm; yellow circle, chicken farm.

