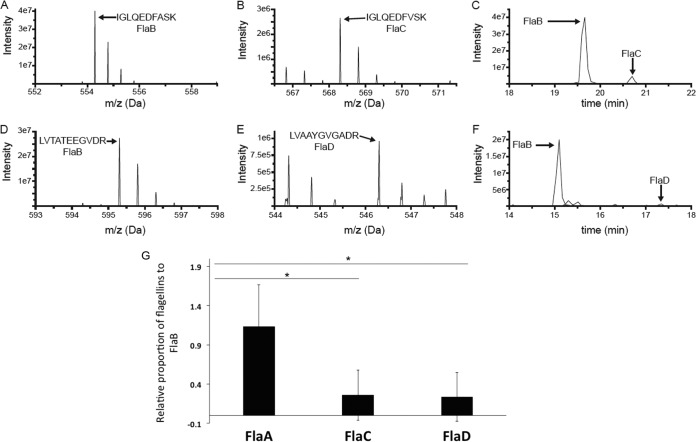
FIG 5.
MS analysis data to determine the relative proportions of flagellin proteins in wild-type filament. (A to F) Representative examples of the MS-based relative quantification of flagellin isoforms. The experiment was conducted three times, and in the case of all peptides, the identity of the MS peak was confirmed at least once by MS/MS. (A and B) MS survey scans of two homologous doubly charged peptides from FlaB (IGLQEDFASK at 554.29 Da) and FlaC (IGLQEDFVSK at 568.30 Da) at the peak of their respective elution times. (C) Signal observed for those peptides as a function of LC elution time, with the peak for the FlaB peptide approximately 10 times more intense than that of the FlaC peptide. (D and E) MS survey scans of two homologous doubly charged peptides from FlaB (LVTATEEGVDR at 595.31 Da) and FlaC (LVAAYGVGADR at 546.30 Da) at the peak of their respective elution times. (F) Signal observed for those peptides as a function of LC elution time, with the peak for the FlaB peptide approximately 25 times more intense than that of the FlaD peptide. (G) Liquid chromatography-tandem mass spectrometry (LC-MS/MS) analysis reveals the relative proportions of flagellin proteins in a wild-type filament preparation. The bar graph reports the relative abundances of FlaA, FlaC, and FlaD with respect to FlaB. FlaB was chosen as a reference, since the FlaB protein had the most peptides that were similar to peptides in the other three isoforms. The horizontal lines with an asterisk above the bars indicate that FlaA-to-FlaB ratio is relatively much higher than FlaC-to-FlaB and FlaD-to-FlaB ratios, via one-way ANOVA.

