
Fig. 3.
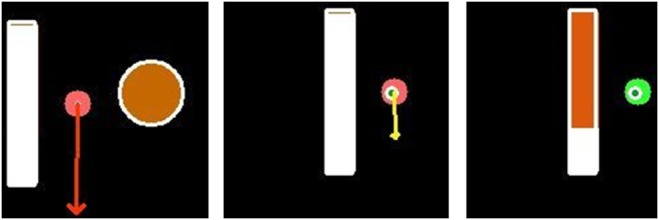
Visualisation of 2D explicit navigation aids. The visualisation contains the needle-surface intersection (red dot), the planned insertion point (orange/green circle with white borders), an arrow for needle alignment (red/yellow arrow) and a depth progress bar (red bar with white borders). After rendering, the visualisation is projected on the patient. Left: Needle is positioned next to the planned insertion point. Middle: Needle is positioned as planned (insertion point got smaller and green) and almost correctly aligned (; arrow turned yellow). Right: Needle is positioned and aligned as planned (arrow turned into a green sphere) and has already been inserted into the body