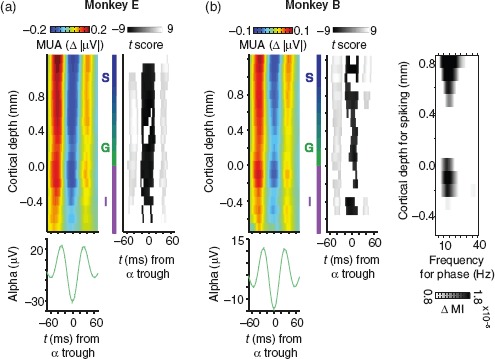
Figure 2.

Coupling of alpha and columnar V1 spiking responses. (a) Colored plots represent the laminar profile of population spiking (MUA) aligned to infragranular alpha troughs. Grayscale plots to the right indicate the corresponding t-score values for statistical comparison. The t-score maps are thresholded to indicate significance at the 0.05 alpha level (Bonferroni-corrected). Left column: monkey E (N = 23 sessions). Right column: monkey B (N = 33 sessions). Alpha-band LFP was chosen from the electrode contact positioned 0.2 mm below the layer 4C current sink. The average alpha waveform (green) for the same set of sessions is shown below the alpha-aligned MUA (error bars are standard error of the mean, SEM). (b) Laminar profile of phase-coupled spiking as a function of LFP frequency. Each data point represents the magnitude of coupling expressed as Tort's MI. MI values were calculated for 3-Hz wide frequency bands incremented in steps of 1 Hz. LFP was taken from an infragranular electrode contact (−0.2 mm). To emphasize laminar specificity, MI values are contrasted to a similarly computed map that used LFP from the granular layer (0.2 mm). Data are averaged across both monkeys (N = 56 sessions).
