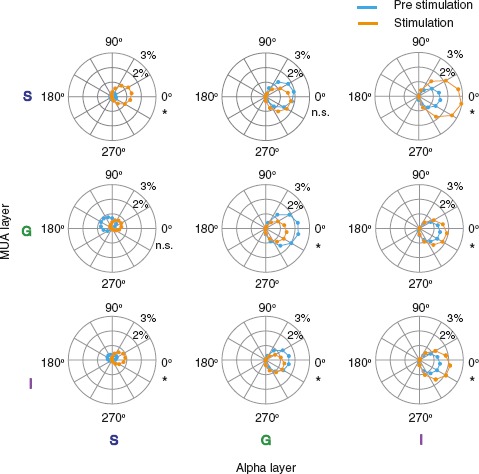
Figure 3.

Phase coupling of V1 spiking across the infragranular alpha cycle before and after visual stimulation. Spiking magnitude is plotted relative to the alpha phase as a function of laminar position and condition. Columns correspond to alpha LFP from supragranular to infragranular layers (left to right). Rows correspond to MUA from supragranular to infragranular layers (top to bottom). Each data point depicts deviation of MUA from the mean at a given phase angle after half-wave rectifying. Data are averaged across monkeys (N = 56 sessions). Asterisks indicate statistically significant differences in peak coupling amplitude between prestimulation and visual stimulation (paired t-tests, P < 0.05, Bonferroni-corrected).
