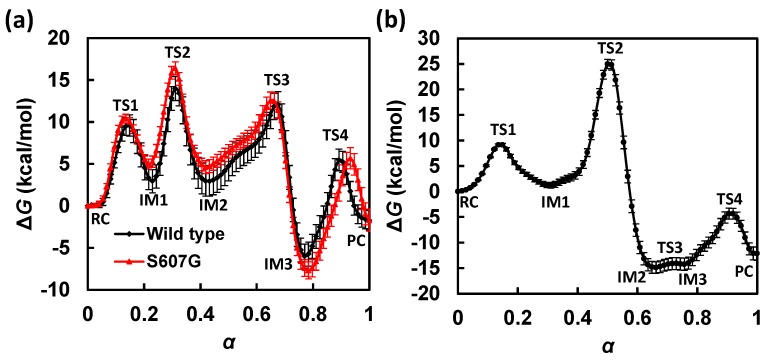
Figure 3.
Comparison of free energy profiles along the minimum free energy paths (MFEPs) for (a) the GAC and (b) the SAC mechanism. The GAC free energy profile for the S607G mutant is also shown in (a) as red (grayscale = gray). The statistical fluctuations of free energy are estimated based on the standard deviations of free energy profiles obtained during the last 10 cycles (i.e., cycles 90 to 100) of string path optimization.

