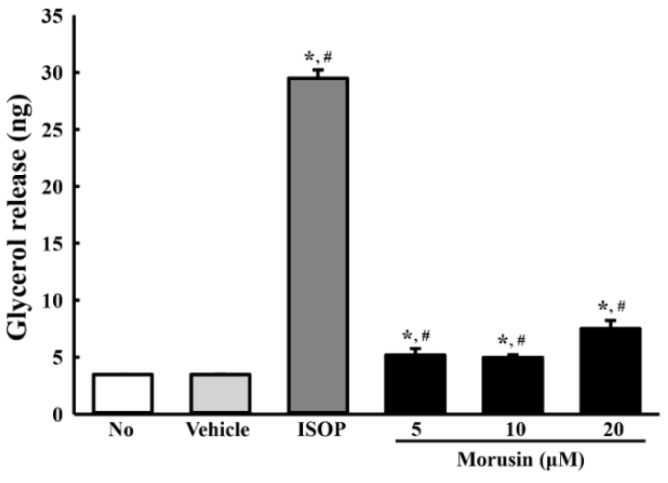
Figure 5.
Free glycerol release of morusin-treated primary adipocytes. Released glycerol was measured in the supernatant of primary adipocytes treated with three different concentrations of morusin. The data represents the means ± SD of three replicates. * indicates p < 0.05 compared to the untreated group. # indicates p < 0.05 compared to the vehicle-treated group. ISOP; Isoproterenol.

