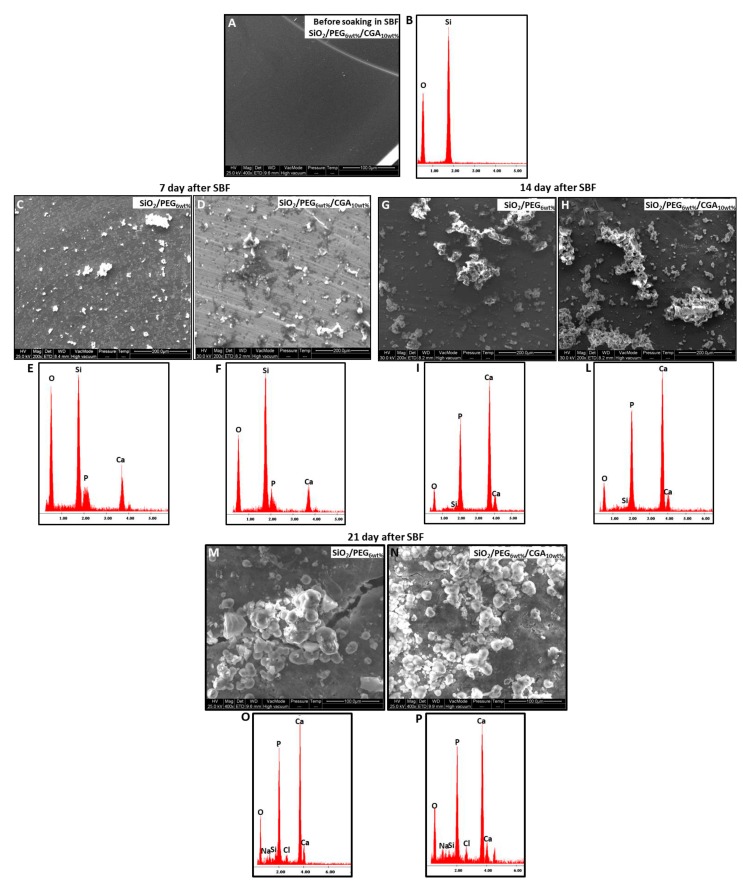
Figure 4.
SEM micrographs of (A) a representative SiO2/PEG6wt%/CGA10wt% hybrid (B) EDX analysis of SiO2/PEG6wt%/CGA10wt% hybrid before exposure to SBF, (C) SiO2/PEG6wt% and (D) a representative SiO2/PEG6wt%/CGA10wt% hybrid after 7 days in SBF; (E) EDX analysis of SiO2/PEG6wt% hybrid and (F) EDX analysis of SiO2/PEG6wt%/CGA10wt% hybrid after 7 days in SBF. (G) SiO2/PEG6wt% and (H) a representative SiO2/PEG6wt%/CGA10wt% hybrid after 14 days in SBF; (I) EDX analysis of SiO2/PEG6wt% hybrid and (L) EDX analysis of SiO2/PEG6wt%/CGA10wt% hybrid after 14 days in SBF. (M) SiO2/PEG6wt% and (N) a representative SiO2/PEG6wt%/CGA10wt% hybrid after 21 days in SBF; (O) EDX analysis of SiO2/PEG6wt% hybrid and (P) EDX analysis of SiO2/PEG6wt%/CGA10wt% hybrid after 21 days in SBF.

