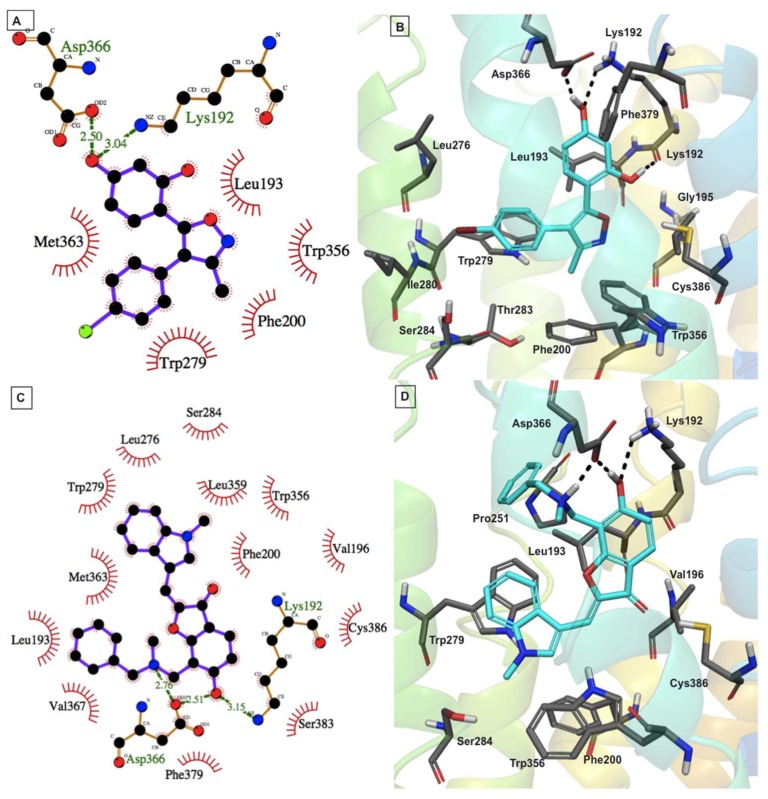
Figure 8.
Putative binding mode of compounds 16 (A,B) and 18 (C,D) with the CB1 model. Two-dimensional interaction views are shown on the left, while three-dimensional interaction views are shown on the right (ligand (cyan colored carbons) and protein binding site residues (dark grey colored carbons) are shown as sticks). The nonpolar hydrogens are not shown, for clarity.

