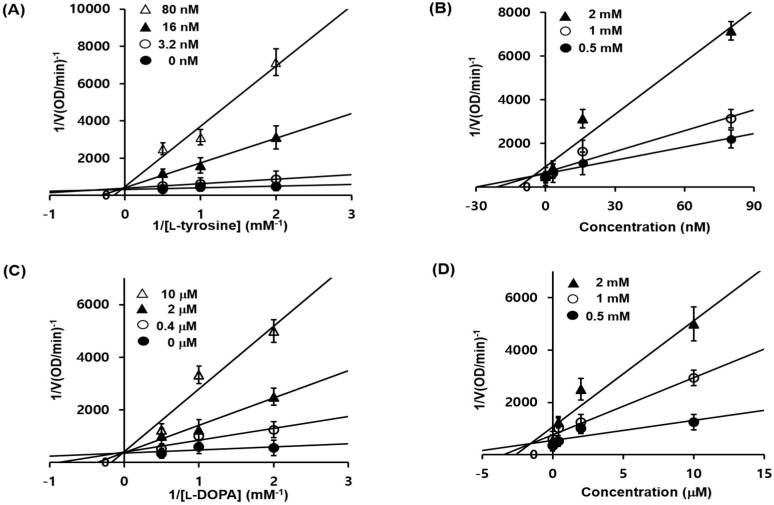
Figure 2.
Lineweaver-Burk and Dixon plots for tyrosinase enzyme inhibition of by compound 1c. Tyrosinase inhibition was analyzed in the presence of different sample concentrations as follows: 0 nM (filled circles), 3.2 nM (open circles), 16 nM (filled triangles), and 80nM (open triangles) (A). Effect of 1c in the presence of different concentrations of substrate (l-tyrosine): 0.5 mM (filled circles), 1 mM (open circles), and 2 mM (filled triangles) (B). Tyrosinase inhibition was analyzed in the presence of different sample concentrations as follows: 0 μM (filled circles), 0.4 μM (open circles), 2 μM (filled triangles), and 10 μM (open triangles) (C). Effect of in 1c the presence of different concentrations of substrate (l-DOPA): 0.5 mM (filled circles), 1 mM (open circles), and 2 mM (filled triangles) (D). The error bar indicates SEM, n = 3.

