
Table 1.
Substitution pattern of the substituted 3-phenyl-1-thiophen-2-yl-propenone derivatives (1a–h).
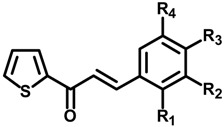
| Compounds | R1 | R2 | R3 | R4 | IC50 (μM) a | IC50 (μM) b |
|---|---|---|---|---|---|---|
| 1a | H | H | OH | H | 46.16 ± 0.55 | 60.05 ± 7.85 |
| 1b | H | OH | OH | H | 75.72 ± 2.46 | 103.44 ± 8.47 |
| 1c | OH | H | OH | H | 0.013 ± 0.64 | 0.93 ± 0.22 |
| 1d | H | OMe | OH | H | 98.78 ± 2.11 | >200 |
| 1e | H | OH | OMe | H | 17.44 ± 1.81 | 28.72 ± 1.98 |
| 1f | H | OMe | OH | OMe | 77.91 ± 8.74 | >200 |
| 1g | H | Br | OH | H | >200 | 112.09 ± 14.27 |
| 1h | H | Br | OH | Br | >200 | >200 |
| Kojic acid c | 22.84 ± 0.09 | 24.57 ± 0.23 |
The IC50 values (μM) were calculated from a log dose inhibition curve using l-tyrosine a and l-DOPA b as a substrate, respectively, and are as means ± standard error of the mean (SEM) of triplicate experiments. c Used as positive control.