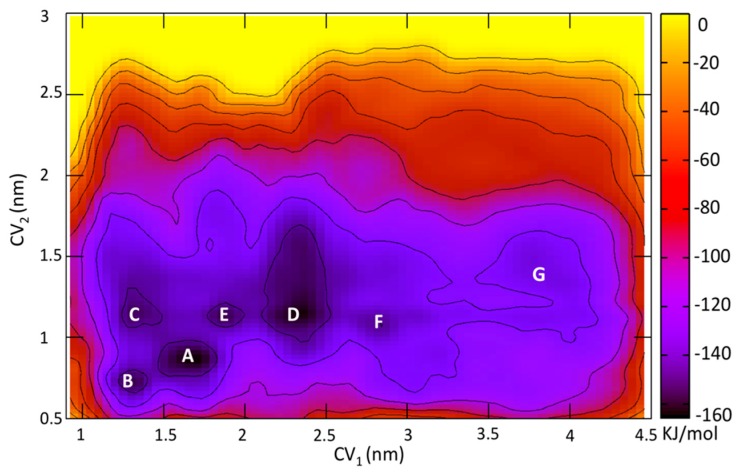
Figure 3.
Free-energy surface associated with ZMA/hA2AR interactions, as a function of collective variables, CV1—a measure of ligand-OBS distance and CV2—a measure of the E169ECL2–H2647.29 distance. The figure shows the minima associated with the ligand located in the OBS A–C, in the vestibular binding site D in the salt bridge E and in a solvent-exposed moiety of the ECL2 F. In the OBS, the free energy in B and C are higher than that in A by 10.0 and 14.6 kJ/mol, respectively. G indicates the unbound state.

