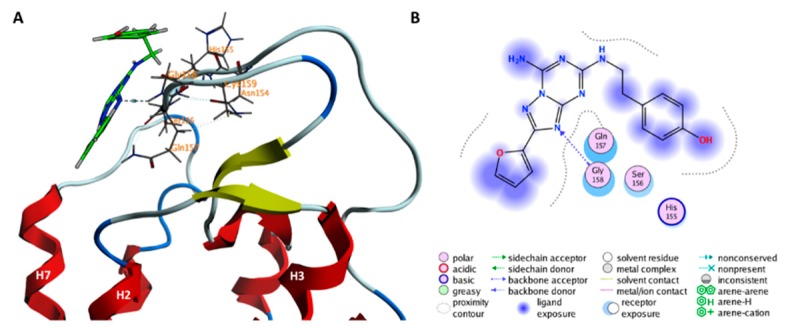
Figure 6.
ZMA binding poses in the minimum F of Figure 1 are shown in the (A,B) panels, as 3D and 2D representation, respectively. In (A) the protein backbone is render as cartoon, ZMA is shown as a green licorice, residues interacting with ZMA are shown as gray lines. Hydrogen, oxygen, and nitrogen atoms are specifically colored in white, red, and light blue, respectively.

