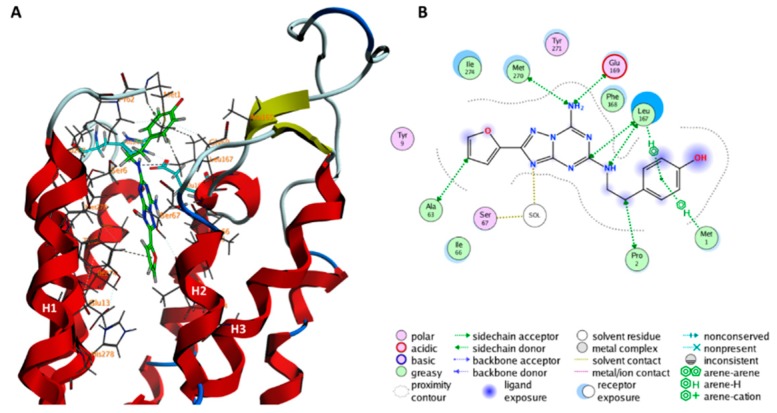
Figure 7.
ZMA binding poses in the minimum E of Figure 3 is shown in (A,B) panels, as 3D and 2D representation, respectively. In (A) the protein backbone is render as cartoon, ZMA is shown as a green licorice, residues interacting with ZMA are shown as gray lines. The E169ECL2 and H2647.29 residues are shown in cyan licorice. Hydrogen, oxygen and nitrogen atoms are specifically colored in white, red and light blue, respectively.

