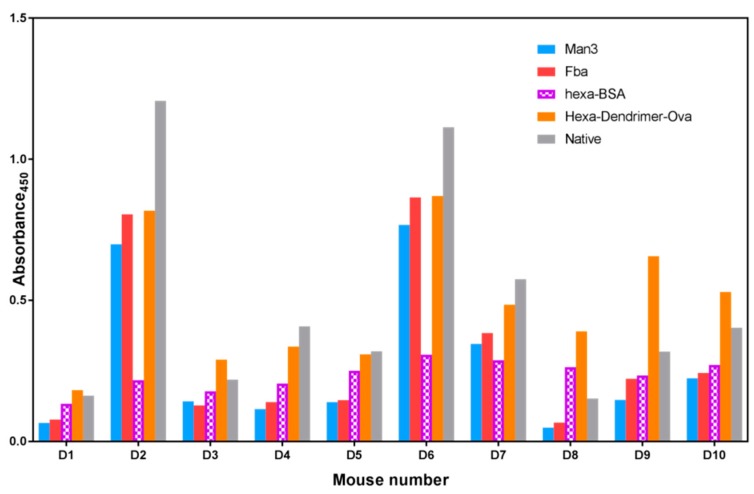
Figure 6.
IgG profile of the final bleed collected from mice vaccinated with dendrimer–glycopeptide conjugate when titrated against various antigens. All the sera were diluted 1:1000. The blue colored bars denote mannotriose response, the red bar denotes Fba response, the blue bar the response to synthetic β-glucan, the orange bar denotes dendrimer–hexasaccharide response, while the grey bar denotes native antigen response. All the data points were plotted after subtracting the background value consisting of all assay reagents but sera.

