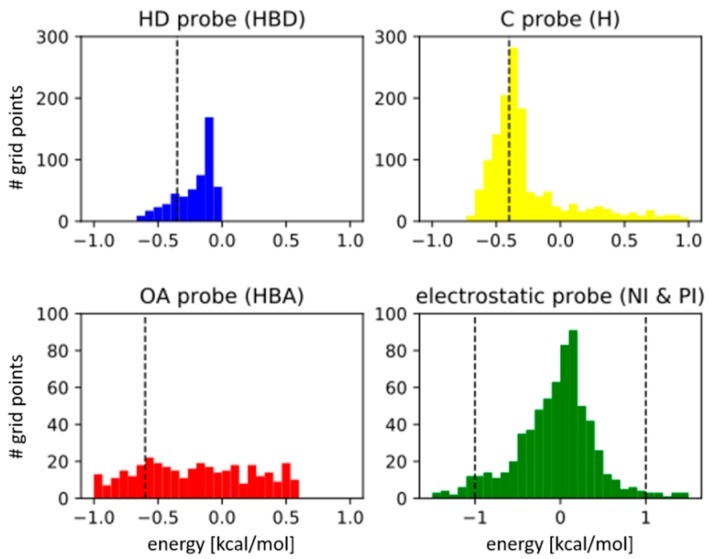
Figure 2.
Energy distribution of the free and buried cavity points from the cavity of cyclin-dependent kinase 2 (CDK2) (Protein Databank (PDB) entry 1AQ1) for the four different probes: H-bond donor (HBD in blue), hydrophobic (H in yellow), H-bond acceptor (HBA in red), and electrostatics (in green). The respective energy cut-offs are represented by a dotted vertical line (points with an energy value above the cut-off are discarded). Note that for electrostatics both extrema are kept, describing positive and negative ionizable (PI and NI) areas, respectively.

