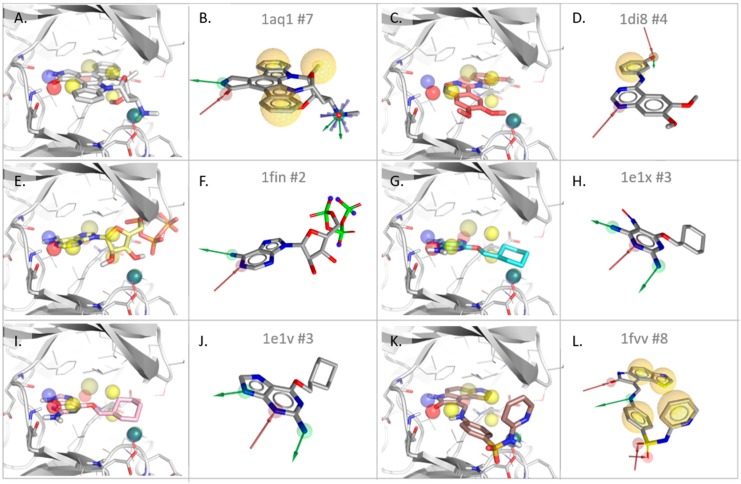
Figure 3.
T2F model derived from the empty CDK2 cavity (PDB entry 1AQ1) superposed to all CDK2-ligands structures used for the evaluation ((A) 1AQ1, (C) 1DI8, (E) 1FIN, (G) 1E1X, (I) 1E1V, and (K) 1FVV) compared to their corresponding structure-based (SB) pharmacophore models (LigandScout: (B) 1AQ1, (D) 1DI8, (F) 1FIN, (H) 1E1X, (J) 1E1V, and (L) 1FVV). The number of features comprised in the SB models is indicated in the respective subfigures. Color coding in the T2F models (first and third column, drawn with PyMol): HBD = blue, HBA = red, H = yellow, and PI = green. Color coding in the SB models (second and fourth column, drawn with LigandScout): HBD = green, HBA = red, H = yellow, and PI = blue.

