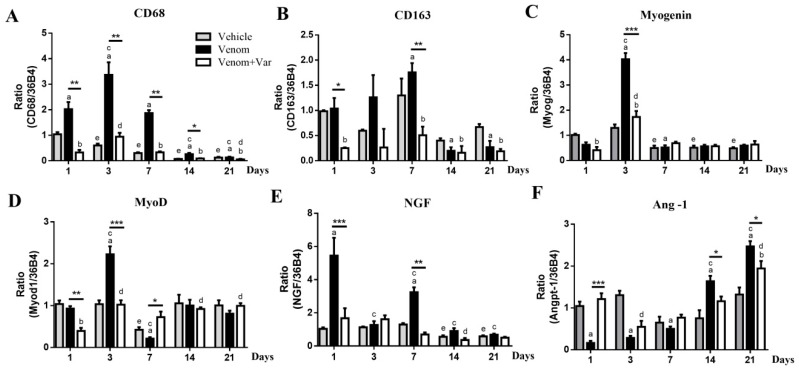
Figure 4.
Gene expression profile of muscle regeneration. (A,B) Molecular markers of M1 and M2 macrophages, CD68 and CD163 exhibited their maximum expression at day 3 and day 7; (C,D) show the relative expression of Myogenin and MyoD, which represented the progression of muscle regeneration; (E) NGF expression was significantly increased in the venom group, indicating major nerve repair during the early stage of envenomation; (F) The bifacial variation of Ang-1 expression indicated early initiation of microvascular repair in the varespladib group, and a deferred repair in the venom group. Results were presented as means ± SD (n = 3). * p: Venom vs. Venom + Var (p < 0.05), ** p < 0.01, *** p < 0.001, “a” p < 0.05 Venom vs. Vehicle, “b” p < 0.05 Venom + Var vs. Vehicle, “c” p < 0.05 Venom vs. Venom day 1, “d” p < 0.05 Venom + Var vs. Venom + Var day 1, “e” p < 0.05 Vehicle vs. Vehicle day 1.

