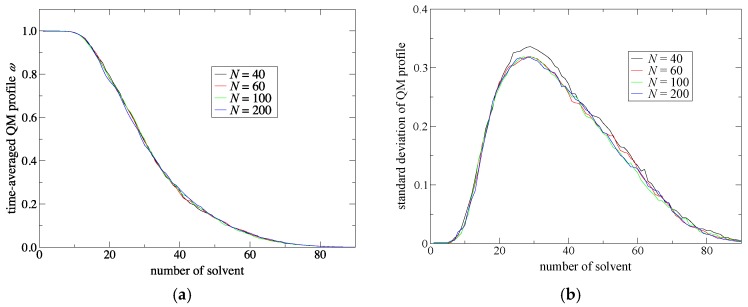
Figure 3.
(a) Time-averaged QM profiles, ω, and (b) their standard deviations obtained from 100 ps SCMP simulations. The horizontal axis represents the solvent number from the QM solute. Black, red, green and blue lines represent the results obtained by the SCMP method with number of partitionings equal to 40, 60, 100 and 200, respectively.

