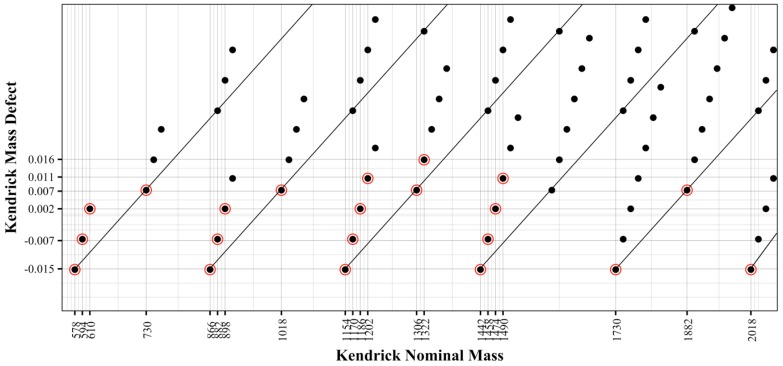
Figure 5.
Kendrick defect analysis, created by plotting the Kendrick mass defect (KMD) and Kendrick nominal mass (KNM). Each solid black point represents the KNM and KMD of the proanthocyanidin calculated in the theoretical database. Compounds which were identified in the wine samples are encircled in red.

