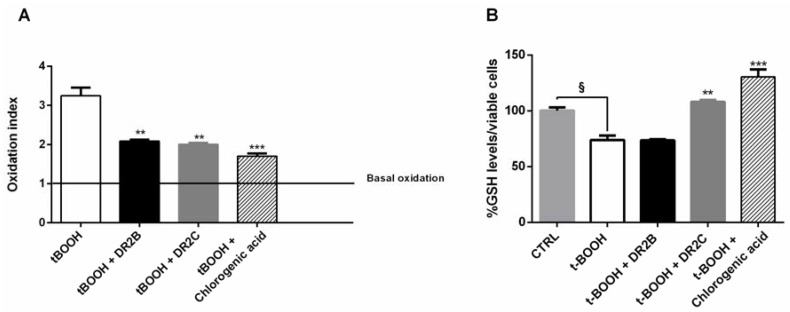
Figure 3.
Effect of DR2B (100 µg/mL), DR2C (100 µg/mL), and chlorogenic acid (50 µg/mL) on the ROS and GSH levels induced by tert-butyl hydroperoxide (tBOOH; 5 μM) in Caco2 cells under normoxia. (A) Reactive oxygen species (ROS) levels expressed as oxidation index with respect to the basal levels. (B) GSH levels measured in cell lysates were normalized to viable cells and expressed as a percentage (level from control cells was considered 100%). Data are mean ± SE from at least two independent biological replicates (n = 2). § p < 0.01 vs. control; *** p < 0.001 and ** p < 0.01 vs. tBOOH by ANOVA followed by Dunnett’s multiple comparison post-test.

