
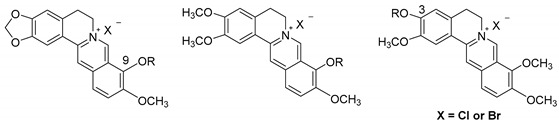
Table 1.
SAR of all target compounds for anti-EV71 activity and cytotoxicity in Vero cells.
| No. | R | TC50 a | H Strain | JS-52 Strain | SHZH98 Strain | BrCr Strain | ||||
|---|---|---|---|---|---|---|---|---|---|---|
| IC50 a | SI b | IC50 a | SI | IC50 a | SI | IC50 a | SI | |||
| BBR | - | 147 | 21.2 | 6.93 | 14.0 | 10.5 | 28.2 | 5.22 | 9.45 | 15.6 |
| 1 | - | 85.5 | 37.0 | 2.31 | 28.5 | 3.00 | 32.6 | 2.62 | 35.4 | 2.41 |
| 3 | - | 254 | 121 | 2.10 | 102 | 2.50 | 132 | 1.93 | 135 | 1.87 |
| JTH | - | 255 | >147 | - | 147 | 1.73 | 147 | 1.73 | >147 | - |
| 2a |

|
223 | 48.3 | 4.62 | 45.5 | 4.89 | 60.4 | 3.69 | 32.3 | 6.90 |
| 2b |

|
22.3 | >5.34 | - | 5.73 | 3.89 | 5.46 | 4.08 | 2.04 | 10.9 |
| 2c |

|
27.9 | 13.8 | 2.02 | 7.26 | 3.84 | 8.59 | 3.24 | 4.26 | 6.54 |
| 2d |

|
82.8 | 12.4 | 6.70 | 7.12 | 11.6 | 14.8 | 5.58 | 8.52 | 9.72 |
| 2d-a |

|
437 | >145 | - | 145 | 3.00 | >145 | - | 145 | 3.00 |
| 2e |

|
14.4 | >5.31 | - | 2.67 | 5.40 | 2.84 | 5.08 | 2.23 | 6.47 |
| 2f |

|
9.22 | >5.33 | - | 1.61 | 5.74 | 1.85 | 4.97 | 2.21 | 4.17 |
| 2g |

|
54.9 | 15.8 | 3.47 | 11.9 | 4.62 | 12.3 | 4.46 | 10.6 | 5.18 |
| 2h |

|
124 | >47.9 | - | >47.9 | - | >47.9 | - | 47.9 | 2.59 |
| 2i |

|
167 | 31.1 | 5.37 | 43.6 | 3.83 | 45.7 | 3.65 | 33.6 | 4.97 |
| 4a |

|
434 | 144 | 3.01 | >144 | - | >144 | - | >144 | - |
| 4b |

|
333 | >144 | - | 109 | 3.05 | >144 | - | 144 | 2.32 |
| 4c |

|
452 | >143 | - | 99.3 | 4.55 | >143 | - | 81.1 | 5.57 |
| 4d |

|
50.0 | >15.9 | - | 44.2 | 1.13 | >47.8 | - | 44.2 | 1.13 |
| 4e |

|
143 | 13.6 | 10.5 | 19.4 | 7.35 | 27.6 | 5.18 | 17.1 | 8.36 |
| 4f |

|
306 | 82.2 | 3.73 | 54.2 | 5.65 | 82.2 | 3.73 | 66.0 | 4.64 |
| 4g |

|
351 | >143 | - | 129 | 2.72 | >143 | - | >143 | - |
| 5a |

|
250 | 130 | 1.93 | 109 | 2.29 | 144 | 1.74 | 125 | 2.01 |
| 5b |

|
83.3 | 41.3 | 2.02 | 34.2 | 2.44 | 69.3 | 1.20 | 34.2 | 2.44 |
| 5c |

|
248 | 93.7 | 2.65 | 101 | 2.46 | 123 | 2.01 | 44.1 | 5.62 |
| 5d |

|
41.0 | >15.9 | - | 9.01 | 4.55 | 12.0 | 3.41 | >15.9 | - |
| 5e |

|
27.6 | 10.4 | 2.65 | 8.69 | 3.18 | 9.13 | 3.03 | 9.20 | 3.01 |
| 5f |

|
143 | 40.4 | 3.54 | 27.0 | 5.36 | 68.4 | 2.09 | 25.4 | 5.63 |
| 5g |

|
265 | 143 | 1.85 | 51.3 | 5.16 | 86.7 | 3.05 | 82.8 | 3.19 |
a The unit of μM was used to measure TC50 (median toxic concentration) and IC50 values which are calculated based on the organic part of the target compounds. The average values of three batches were shown in this table (n = 3). b SI was calculated as the ratio of TC50 and IC50.