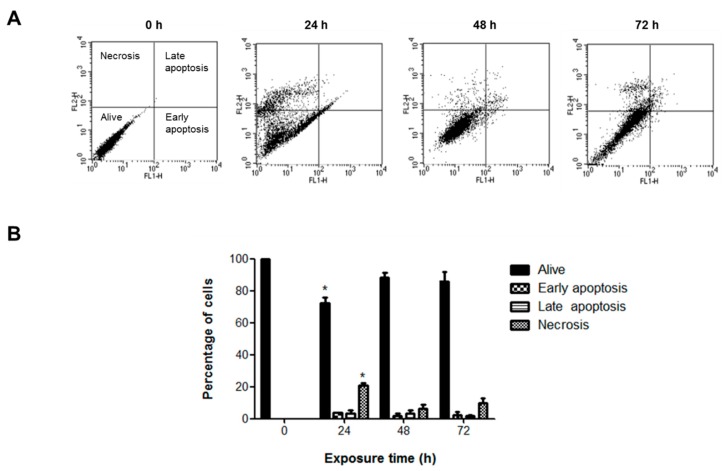
Figure 6.
TiO2 NPs induced necrotic death. H9c2 cells were treated with 20 μg/cm2 TiO2 NPs for 24, 48, and 72 h, then apoptotic and necrotic death was measured by annexin-V and propidium iodide staining. Dot blots show resolution of live, apoptotic and necrotic populations (A) and the bar chart show the percentages (B) as mean ± standard deviation (SD) of three independent experiments (n = 3). * Significant difference between control (untreated) and treated cells (p < 0.05).

