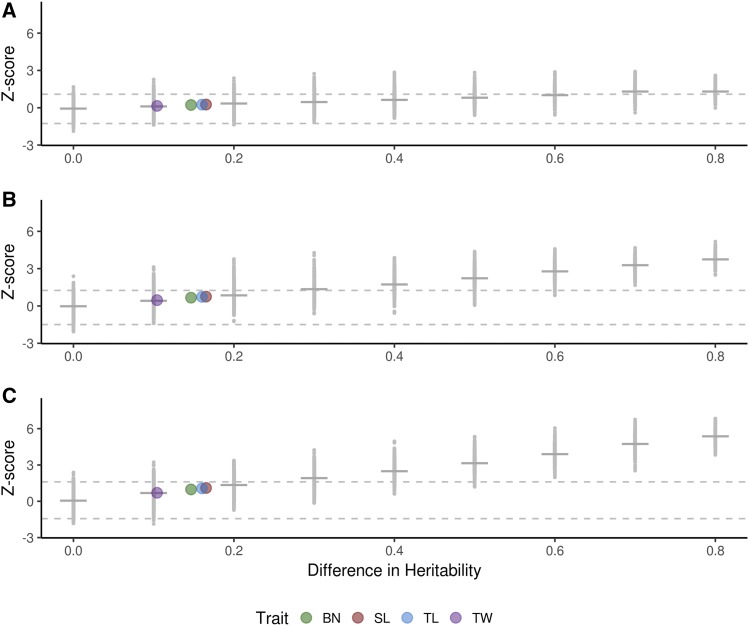
Figure 3.
Results of testing area under the curve for simulated phenotypes. The Z score for testing the difference of two AUCs is plotted against the absolute difference in heritability (D) between the two traits. Traits are controlled by 10 (A), 100 (B), or 1000 (C) causal loci. Small gray dots represent the Z score from a single pairwise test between simulated traits, while horizontal gray bars represent the median Z score for a given D. Larger colored dots represent the D estimates for real traits, plotted along the line that best fits the Z scores of the simulated data. Dashed lines represent the thresholds for significance at α=0.05 (i.e., 2.5th and 97.5th percentiles), calculated from the empirical distribution of Z when D = 0. BN: branch number; SL: spike length; TL: tassel length; TW: tassel weight.

