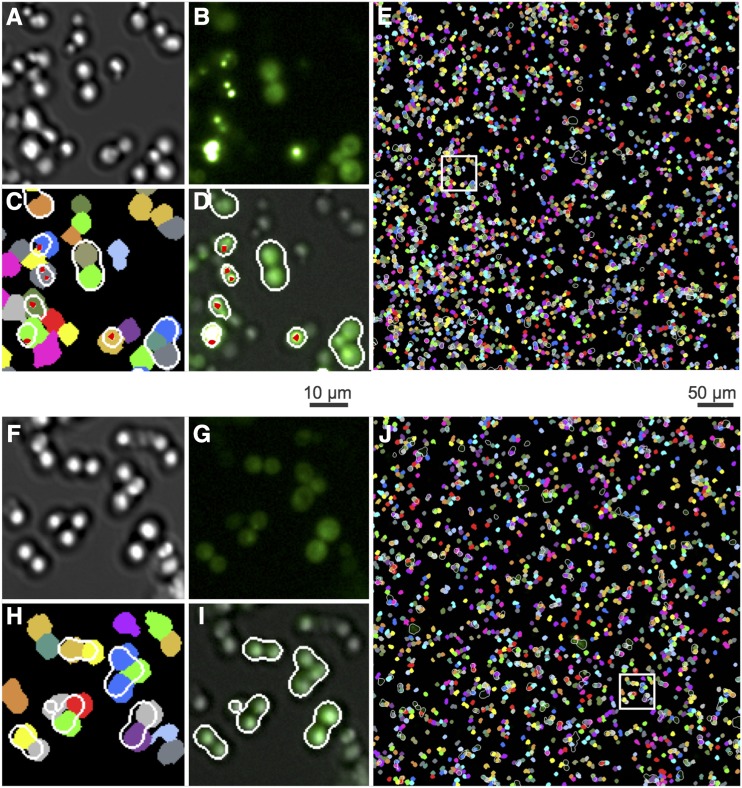
Figure 2.
Quantitative imaging methods for protein aggregation in yeast. Automated protein aggregate counting in yeast attached to glass-bottomed 96-well plates. Representative fields are shown for a segregant exhibiting high aggregation (Upper Panel, A-E) and a segregant with low aggregation (Lower Panel, F-J). Captured DIC (A, F) and fluorescent (B, G) images were used to digitally segment cells and fluorescent patterns respectively. Automated Image processing segmented DIC images to identify individual cells (C, H colored segments) and binarized GFP fluorescence after high pass or low band pass spatial filtering to mark protein aggregates (red dots) or diffuse fluorescence (outlined in white), respectively (D, I). Thus, D,I images represent GFP and DIC overlaid images with cells exhibiting fluorescence circled in white trace, and GFP-positive foci marked with a red dot. These data were then used to calculate the number of individual cells that also contain foci and diffuse fluorescence features and subsequently used to determine the percentage of fluorescent cells with foci. The white boxes in (E, J) refer to regions magnified in the corresponding smaller four images to the left.

