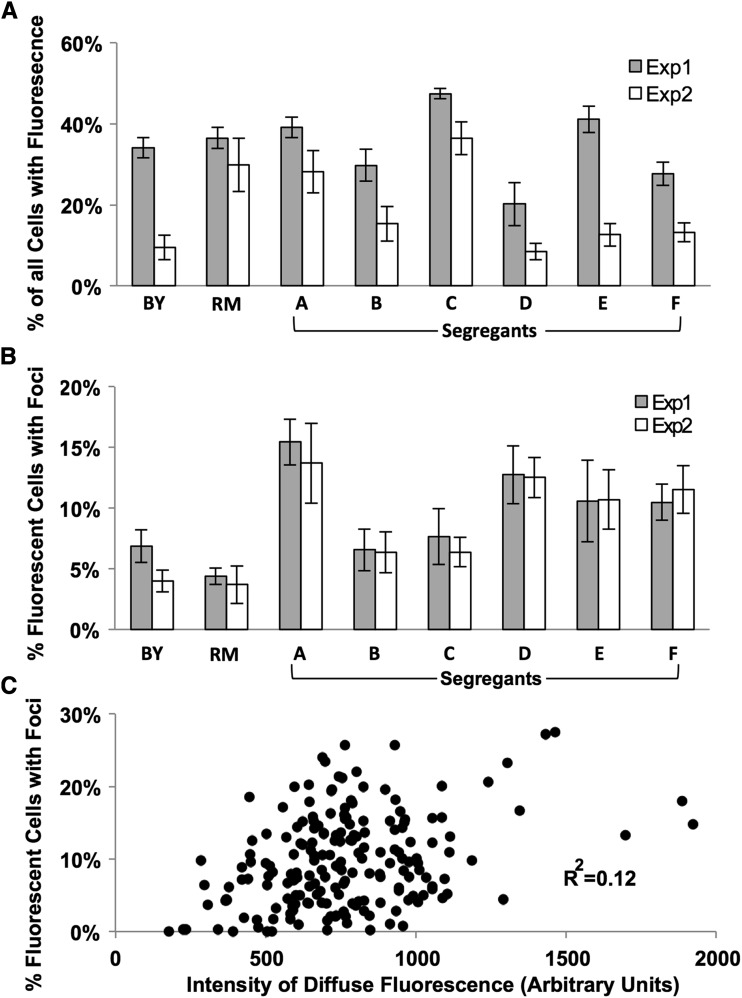
Figure 3.
A quantitative fluorescence microscopy assay for Htt-Q75-GFP aggregation. Fluorescence patterns were quantitated in parent strains and segregants using an empirically derived algorithm to identify cells with fluorescence (A) or the percentage of fluorescent cells with foci (B) in two distinct experiments. (C) The diffuse fluorescence intensity was quantitated in all replicates of parent strains and 29 segregant strains in an area of the cell excluding foci. This intensity was plotted against the percentage of fluorescent cells with foci in the same samples. Each strain had at least five independent replicates quantitated; each point represents an average of over 1000 cells analyzed per replicate.

