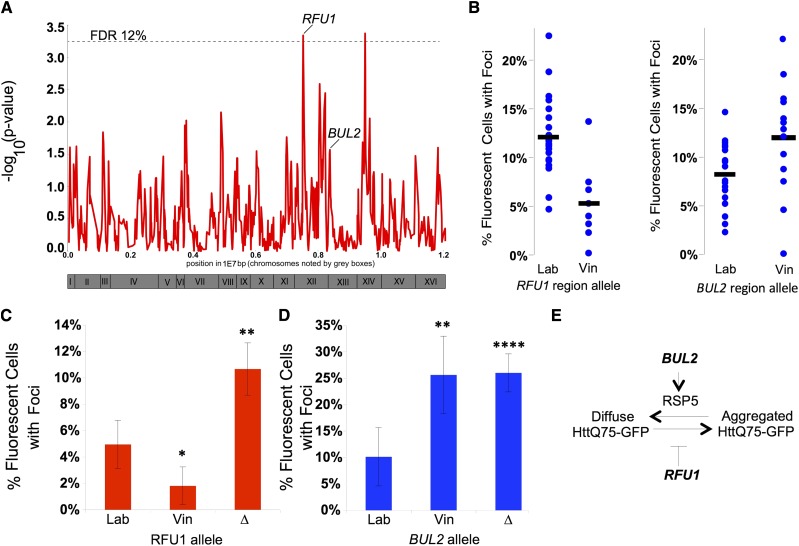
Figure 4.
QTL analysis identifies segregating loci and genes that influence Htt-Q75-GFP aggregation. (A) Strength of linkage across segregant strains relative to genomic position. Dotted line represents the signal strength corresponding to a false discovery rate of 12% in randomly permuted data. Loci with validated genetic modifiers are labeled. Roman numerals refer to relative positioning on the yeast chromosomes. (B) Aggregation of segregant strains (blue dots) binned by allele at the RFU1 locus (left) or BUL2 locus (right). (C, D) Aggregation of the Htt-Q75-GFP protein was quantitated in the laboratory strain carrying either the laboratory allele (Lab), vineyard allele (Vin), or deletion cassette (∆) of the (C) BUL2 gene or (D) RFU1 gene. (E) Model for the influence of BUL2 and RFU1 on aggregation of the Htt-Q75-GFP protein. * = p-value < 0.05; ** = p-value < 0.01; *** = p-value < 0.005 in tests of the indicated strain relative to the laboratory wild-type. Error bars report standard error of the mean.

