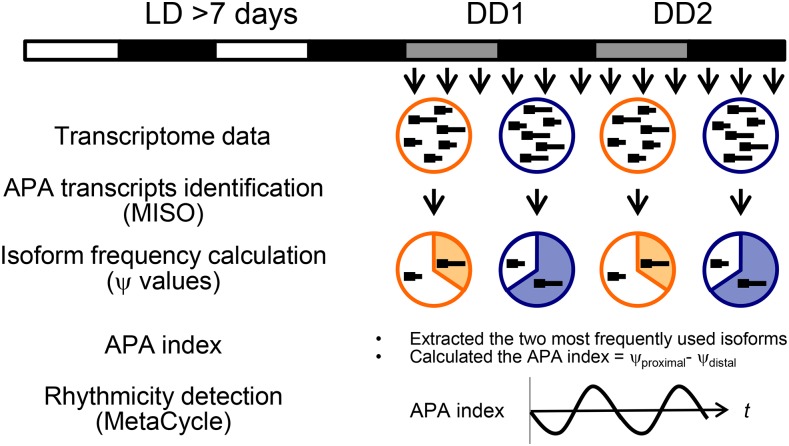
Figure 1.
Schematic representation of our strategy to identify circadian APA genes. Briefly, we obtained three circadian transcriptome datasets from NCBI SRA. We then applied the Mixture-of-Isoforms probabilistic model (MISO) to detect alternatively polyadenylated transcripts. MISO further calculated “ψ values” of each transcript that represent the expression levels of alternatively polyadenylated isoforms relative to that of the total transcript within each sample (i.e., each time point). We subsequently extracted isoforms whose ψ numbers (average of all time points) were the two highest to simplify the analyses, and then designated the “APA index” of this combination for each time point, by calculating = ψ proximal - ψ distal. The rhythmicity of the APA index was assessed by MetaCycle. White/black bars and gray/black bars indicate light:dark (LD) = 12:12 or constant dark (DD) conditions, respectively, at which tissues were harvested.

