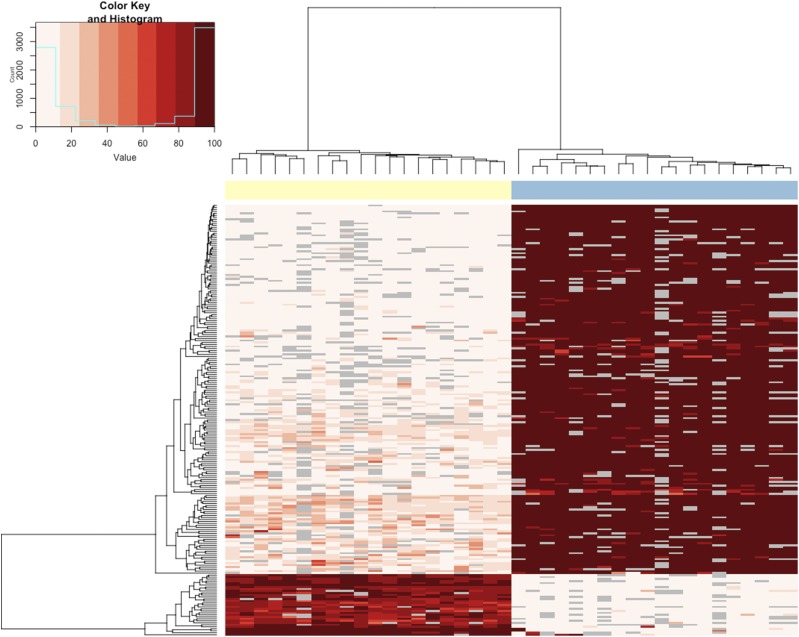
Figure 2.
Hierarchical clustering of cell-type specific DMRs (217 tDMRs with >75% difference in methylation). Each column represents a cell-type from an individual fish. The cell-types are identified by color (RBCs = yellow, sperm = blue) at the top of the column. Each row represents a DMR. The heatmap depicts percent methylation for each 100bp region for each individual (n = 20 RBC, n = 20 sperm) with the darkest red indicating 100% methylation and the lightest indicating 0% methylation. The regions that did not meet the coverage cutoff for a particular individual are represented by gray boxes.

