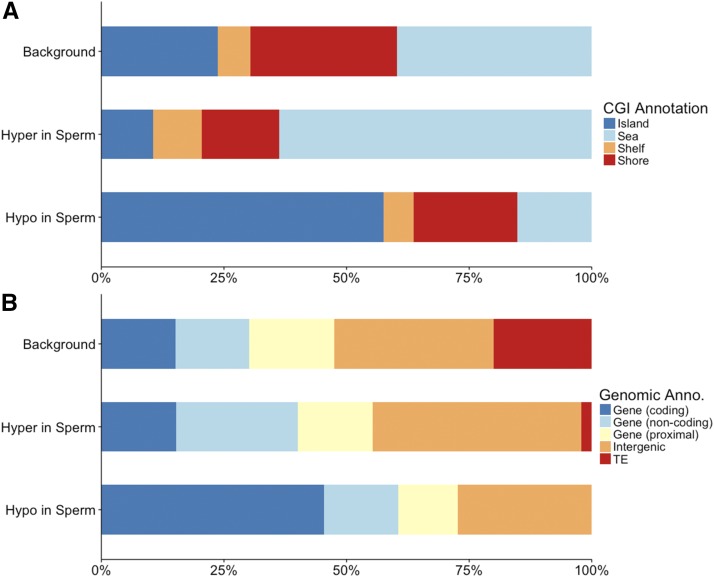
Figure 3.
Annotation of tissue-specific DMRs (tDMRs) (Hypo in Sperm and Hyper in Sperm (compared to RBCs)) compared to the background of all 100 bp regions analyzed by RRBS (Background). Top panel (A) shows annotations relative to CG islands. Bottom panel (B) shows annotation relative to genes (coding regions (coding), intronic and untranslated regions (non-coding), within 10kb of a gene (proximal)), transposable elements (TE) and unannotated intergenic regions.

